
Does Cintas (NASDAQ:CTAS) Have A Healthy Balance Sheet?
Does Cintas (NASDAQ:CTAS) Have A Healthy Balance Sheet?
 Zooming in on the latest balance sheet data, we can see that Cintas had liabilities of US$1.27b due within 12 months and liabilities of US$3.47b due beyond that. Offsetting this, it had US$128.5m in cash and US$1.26b in receivables that were due within 12 months. So its liabilities outweigh the sum of its cash and (near-term) receivables by US$3.35b.
 Some say volatility, rather than debt, is the best way to think about risk as an investor, but Warren Buffett famously said that 'Volatility is far from synonymous with risk.' It's only natural to consider a company's balance sheet when you examine how risky it is, since debt is often involved when a business collapses. We can see that Cintas Corporation (NASDAQ:CTAS) does use debt in its business. But the real question is whether this debt is making the company risky.
有人說,波動性,而不是債務,是投資者思考風險的最佳方式,但禾倫·巴菲特曾說過一句名言:“波動性遠非風險的代名詞。”當你檢查公司的資產負債表的風險時,考慮它的資產負債表是很自然的,因爲企業倒閉時通常會涉及債務。我們可以看到,辛塔斯公司(納斯達克股票代碼:CTAS)確實在其業務中使用了債務。但真正的問題是這筆債務是否使公司面臨風險。
When Is Debt A Problem?
債務何時會成爲問題?
Generally speaking, debt only becomes a real problem when a company can't easily pay it off, either by raising capital or with its own cash flow. If things get really bad, the lenders can take control of the business. However, a more common (but still painful) scenario is that it has to raise new equity capital at a low price, thus permanently diluting shareholders. By replacing dilution, though, debt can be an extremely good tool for businesses that need capital to invest in growth at high rates of return. The first step when considering a company's debt levels is to consider its cash and debt together.
一般而言,只有當公司無法通過籌集資金或用自己的現金流輕鬆還清債務時,債務才會成爲真正的問題。如果情況變得非常糟糕,貸款人可以控制業務。但是,更常見(但仍然令人痛苦)的情況是,它必須以低廉的價格籌集新的股本,從而永久稀釋股東。但是,通過取代稀釋,債務可以成爲需要資本以高回報率投資增長的企業的極好工具。考慮公司的債務水平的第一步是同時考慮其現金和債務。
How Much Debt Does Cintas Carry?
辛塔斯揹負了多少債務?
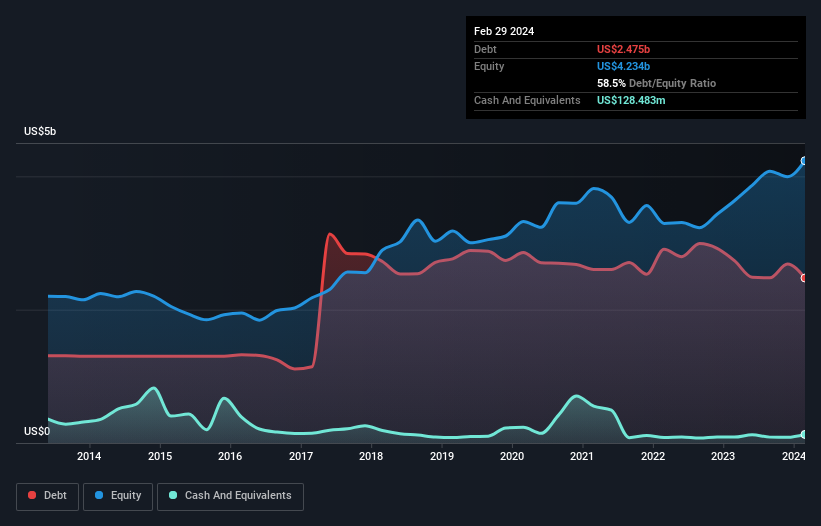
You can click the graphic below for the historical numbers, but it shows that Cintas had US$2.47b of debt in February 2024, down from US$2.74b, one year before. However, because it has a cash reserve of US$128.5m, its net debt is less, at about US$2.35b.
你可以點擊下圖查看歷史數字,但它顯示Cintas在2024年2月的債務爲24.7億美元,低於一年前的27.4億美元。但是,由於其現金儲備爲1.285億美元,其淨負債較少,約爲23.5億美元。
A Look At Cintas' Liabilities
看看 Cintas 的負債
Zooming in on the latest balance sheet data, we can see that Cintas had liabilities of US$1.27b due within 12 months and liabilities of US$3.47b due beyond that. Offsetting this, it had US$128.5m in cash and US$1.26b in receivables that were due within 12 months. So its liabilities outweigh the sum of its cash and (near-term) receivables by US$3.35b.
放大最新的資產負債表數據,我們可以看到,Cintas在12個月內到期的負債爲12.7億美元,之後到期的負債爲34.7億美元。與此相抵消的是,它有1.285億美元的現金和12.6億美元的應收賬款將在12個月內到期。因此,其負債超過其現金和(短期)應收賬款總額33.5億美元。
Of course, Cintas has a titanic market capitalization of US$70.2b, so these liabilities are probably manageable. Having said that, it's clear that we should continue to monitor its balance sheet, lest it change for the worse.
當然,Cintas的市值高達702億美元,因此這些負債可能是可以控制的。話雖如此,很明顯,我們應該繼續監控其資產負債表,以免情況惡化。
In order to size up a company's debt relative to its earnings, we calculate its net debt divided by its earnings before interest, tax, depreciation, and amortization (EBITDA) and its earnings before interest and tax (EBIT) divided by its interest expense (its interest cover). This way, we consider both the absolute quantum of the debt, as well as the interest rates paid on it.
爲了擴大公司相對於收益的負債規模,我們計算其淨負債除以利息、稅項、折舊和攤銷前的收益(EBITDA),將其利息和稅前收益(EBIT)除以利息支出(利息保障)。這樣,我們既考慮債務的絕對數量,也考慮爲債務支付的利率。
Cintas has a low net debt to EBITDA ratio of only 1.0. And its EBIT covers its interest expense a whopping 20.0 times over. So we're pretty relaxed about its super-conservative use of debt. Also good is that Cintas grew its EBIT at 15% over the last year, further increasing its ability to manage debt. The balance sheet is clearly the area to focus on when you are analysing debt. But it is future earnings, more than anything, that will determine Cintas's ability to maintain a healthy balance sheet going forward. So if you're focused on the future you can check out this free report showing analyst profit forecasts.
辛塔斯的淨負債與息稅折舊攤銷前利潤的比率很低,僅爲1.0。其息稅前利潤覆蓋了高達20.0倍的利息支出。因此,我們對它超保守的債務使用相當放鬆。同樣不錯的是,Cintas的息稅前利潤比去年增長了15%,進一步提高了其管理債務的能力。資產負債表顯然是分析債務時需要關注的領域。但是,未來的收益比什麼都重要,將決定辛塔斯未來維持健康資產負債表的能力。因此,如果您專注於未來,可以查看這份顯示分析師利潤預測的免費報告。
Finally, a business needs free cash flow to pay off debt; accounting profits just don't cut it. So we clearly need to look at whether that EBIT is leading to corresponding free cash flow. During the last three years, Cintas produced sturdy free cash flow equating to 77% of its EBIT, about what we'd expect. This cold hard cash means it can reduce its debt when it wants to.
最後,企業需要自由現金流來償還債務;會計利潤根本無法減少債務。因此,我們顯然需要研究息稅前利潤是否會帶來相應的自由現金流。在過去三年中,Cintas產生了穩健的自由現金流,相當於其息稅前利潤的77%,與我們的預期差不多。這種冷硬現金意味着它可以在需要時減少債務。
Our View
我們的觀點
Happily, Cintas's impressive interest cover implies it has the upper hand on its debt. And the good news does not stop there, as its conversion of EBIT to free cash flow also supports that impression! Looking at the bigger picture, we think Cintas's use of debt seems quite reasonable and we're not concerned about it. While debt does bring risk, when used wisely it can also bring a higher return on equity. When analysing debt levels, the balance sheet is the obvious place to start. However, not all investment risk resides within the balance sheet - far from it. To that end, you should be aware of the 1 warning sign we've spotted with Cintas .
令人高興的是,辛塔斯令人印象深刻的利息保障意味着它在債務上佔了上風。好消息不止於此,因爲其將息稅前利潤轉換爲自由現金流也支持了這種印象!從大局來看,我們認爲辛塔斯對債務的使用似乎相當合理,我們對此並不擔心。雖然債務確實會帶來風險,但如果明智地使用,它也可以帶來更高的股本回報率。在分析債務水平時,資產負債表是顯而易見的起點。但是,並非所有的投資風險都存在於資產負債表中,遠非如此。爲此,你應該注意我們在Cintas身上發現的1個警告標誌。
When all is said and done, sometimes its easier to focus on companies that don't even need debt. Readers can access a list of growth stocks with zero net debt 100% free, right now.
當一切都說完之後,有時更容易將注意力集中在甚至不需要債務的公司上。讀者現在可以100%免費訪問淨負債爲零的成長型股票清單。
Have feedback on this article? Concerned about the content? Get in touch with us directly. Alternatively, email editorial-team (at) simplywallst.com.
This article by Simply Wall St is general in nature. We provide commentary based on historical data and analyst forecasts only using an unbiased methodology and our articles are not intended to be financial advice. It does not constitute a recommendation to buy or sell any stock, and does not take account of your objectives, or your financial situation. We aim to bring you long-term focused analysis driven by fundamental data. Note that our analysis may not factor in the latest price-sensitive company announcements or qualitative material. Simply Wall St has no position in any stocks mentioned.
對這篇文章有反饋嗎?對內容感到擔憂?直接聯繫我們。 或者,給編輯團隊 (at) simplywallst.com 發送電子郵件。
Simply Wall St的這篇文章本質上是籠統的。我們僅使用公正的方法根據歷史數據和分析師的預測提供評論,我們的文章無意作爲財務建議。它不構成買入或賣出任何股票的建議,也沒有考慮到您的目標或財務狀況。我們的目標是爲您提供由基本數據驅動的長期重點分析。請注意,我們的分析可能不考慮最新的價格敏感型公司公告或定性材料。簡而言之,華爾街沒有持有任何上述股票的頭寸。
譯文內容由第三人軟體翻譯。