
Despite an already strong run, Shandong Cynda Chemical Co.,Ltd. (SHSE:603086) shares have been powering on, with a gain of 26% in the last thirty days. Unfortunately, the gains of the last month did little to right the losses of the last year with the stock still down 33% over that time.
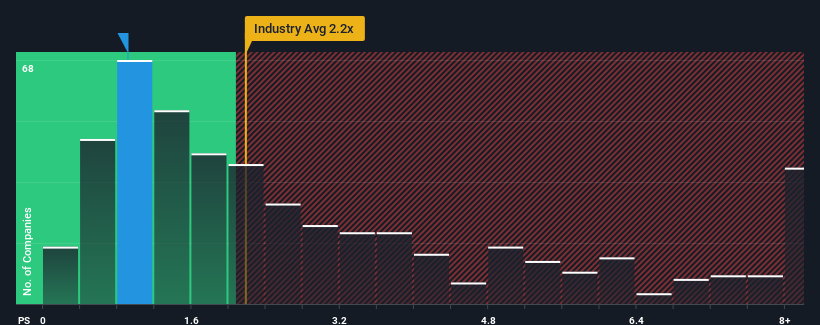
In spite of the firm bounce in price, Shandong Cynda ChemicalLtd may still be sending buy signals at present with its price-to-sales (or "P/S") ratio of 0.9x, considering almost half of all companies in the Chemicals industry in China have P/S ratios greater than 2.2x and even P/S higher than 5x aren't out of the ordinary. Although, it's not wise to just take the P/S at face value as there may be an explanation why it's limited.
How Shandong Cynda ChemicalLtd Has Been Performing
For instance, Shandong Cynda ChemicalLtd's receding revenue in recent times would have to be some food for thought. It might be that many expect the disappointing revenue performance to continue or accelerate, which has repressed the P/S. If you like the company, you'd be hoping this isn't the case so that you could potentially pick up some stock while it's out of favour.
We don't have analyst forecasts, but you can see how recent trends are setting up the company for the future by checking out our free report on Shandong Cynda ChemicalLtd's earnings, revenue and cash flow.How Is Shandong Cynda ChemicalLtd's Revenue Growth Trending?
Shandong Cynda ChemicalLtd's P/S ratio would be typical for a company that's only expected to deliver limited growth, and importantly, perform worse than the industry.
Retrospectively, the last year delivered a frustrating 22% decrease to the company's top line. This has soured the latest three-year period, which nevertheless managed to deliver a decent 23% overall rise in revenue. Accordingly, while they would have preferred to keep the run going, shareholders would be roughly satisfied with the medium-term rates of revenue growth.
Comparing that to the industry, which is predicted to deliver 23% growth in the next 12 months, the company's momentum is weaker, based on recent medium-term annualised revenue results.
In light of this, it's understandable that Shandong Cynda ChemicalLtd's P/S sits below the majority of other companies. Apparently many shareholders weren't comfortable holding on to something they believe will continue to trail the wider industry.
What We Can Learn From Shandong Cynda ChemicalLtd's P/S?
Despite Shandong Cynda ChemicalLtd's share price climbing recently, its P/S still lags most other companies. While the price-to-sales ratio shouldn't be the defining factor in whether you buy a stock or not, it's quite a capable barometer of revenue expectations.
Our examination of Shandong Cynda ChemicalLtd confirms that the company's revenue trends over the past three-year years are a key factor in its low price-to-sales ratio, as we suspected, given they fall short of current industry expectations. At this stage investors feel the potential for an improvement in revenue isn't great enough to justify a higher P/S ratio. Unless the recent medium-term conditions improve, they will continue to form a barrier for the share price around these levels.
You should always think about risks. Case in point, we've spotted 1 warning sign for Shandong Cynda ChemicalLtd you should be aware of.
Of course, profitable companies with a history of great earnings growth are generally safer bets. So you may wish to see this free collection of other companies that have reasonable P/E ratios and have grown earnings strongly.
Have feedback on this article? Concerned about the content? Get in touch with us directly. Alternatively, email editorial-team (at) simplywallst.com.
This article by Simply Wall St is general in nature. We provide commentary based on historical data and analyst forecasts only using an unbiased methodology and our articles are not intended to be financial advice. It does not constitute a recommendation to buy or sell any stock, and does not take account of your objectives, or your financial situation. We aim to bring you long-term focused analysis driven by fundamental data. Note that our analysis may not factor in the latest price-sensitive company announcements or qualitative material. Simply Wall St has no position in any stocks mentioned.