- Dow Jones continues march to fresh all-time highs, approaching 40,000.00.
- US CPI inflation ticked lower in April, sparking fresh Fed rate cut hopes.
- US Retail Sales eased, further bolstering hopes that downturn will push Fed to cut.
The Dow Jones Industrial Average (DJIA) clipped into a fresh all-time high on Wednesday, gaining almost nine-tenths of a percent during the US market session after US Consumer Price Index (CPI) inflation slipped further back. Broad-market hopes for Federal Reserve (Fed) rate cuts in the third quarter of 2024 reignited as inflation continues to cool and economic activity recedes.
US CPI inflation in April eased to 0.3% MoM compared to the forecast hold at 0.4%. Core US CPI also ticked lower, meeting forecasts of 3.6% YoY versus the previous period’s 3.8%. Inflation is still running much higher than the Fed’s 2% annual target, but steady progress is pushing up market bets that the Fed will make a first quarter-point cut in September.
US Retail Sales in April also receded faster than expected, printing flat at 0.0% for the month. Median market estimates expected US Retail Sales to tick down to 0.4% from the previous 0.6%, revised from 0.7%.
With inflation grinding slowly towards targets and wobbly domestic economic activity flashing warning signs of weakness, investors are scrambling for Fed rate cut bets. According to the CME’s FedWatch Tool, rate traders are now pricing in 71% odds of a first 25-basis-point rate cut in September.
Dow Jones news
Over two-thirds of the Dow Jones' constituent securities finished Wednesday in the green. Salesforce Inc. (CRM) led the charge, gaining 3.88% and ending the day at $287.54 per share as analysts expect the stock to outperform its already-lofty performance expectations of 12% YoY growth On the low side, Walt Disney Co. (DIS) shed -2.45% on Wednesday, falling to $102.77 per share after the company revealed softer-than-expected Q2 earnings.
Dow Jones technical outlook
The Dow Jones climbed into a new all-time high of 39,938.25, coming within inches of the 40,000.00 handle. The DJIA is pushing further into a bull run that kicked off after a mild pullback near 37,500.00. The Dow Jones is poised to close another day in the green, and has seen upside momentum in all but one of the last ten consecutive trading days.
Bulls are firmly in control with the Dow Jones trading well above the 200-day Exponential Moving Average (EMA) at 36,993.87. The DJIA is up nearly 6% for 2024, and 18% since crossing above the 200-day EMA back in November.
Dow Jones five minute chart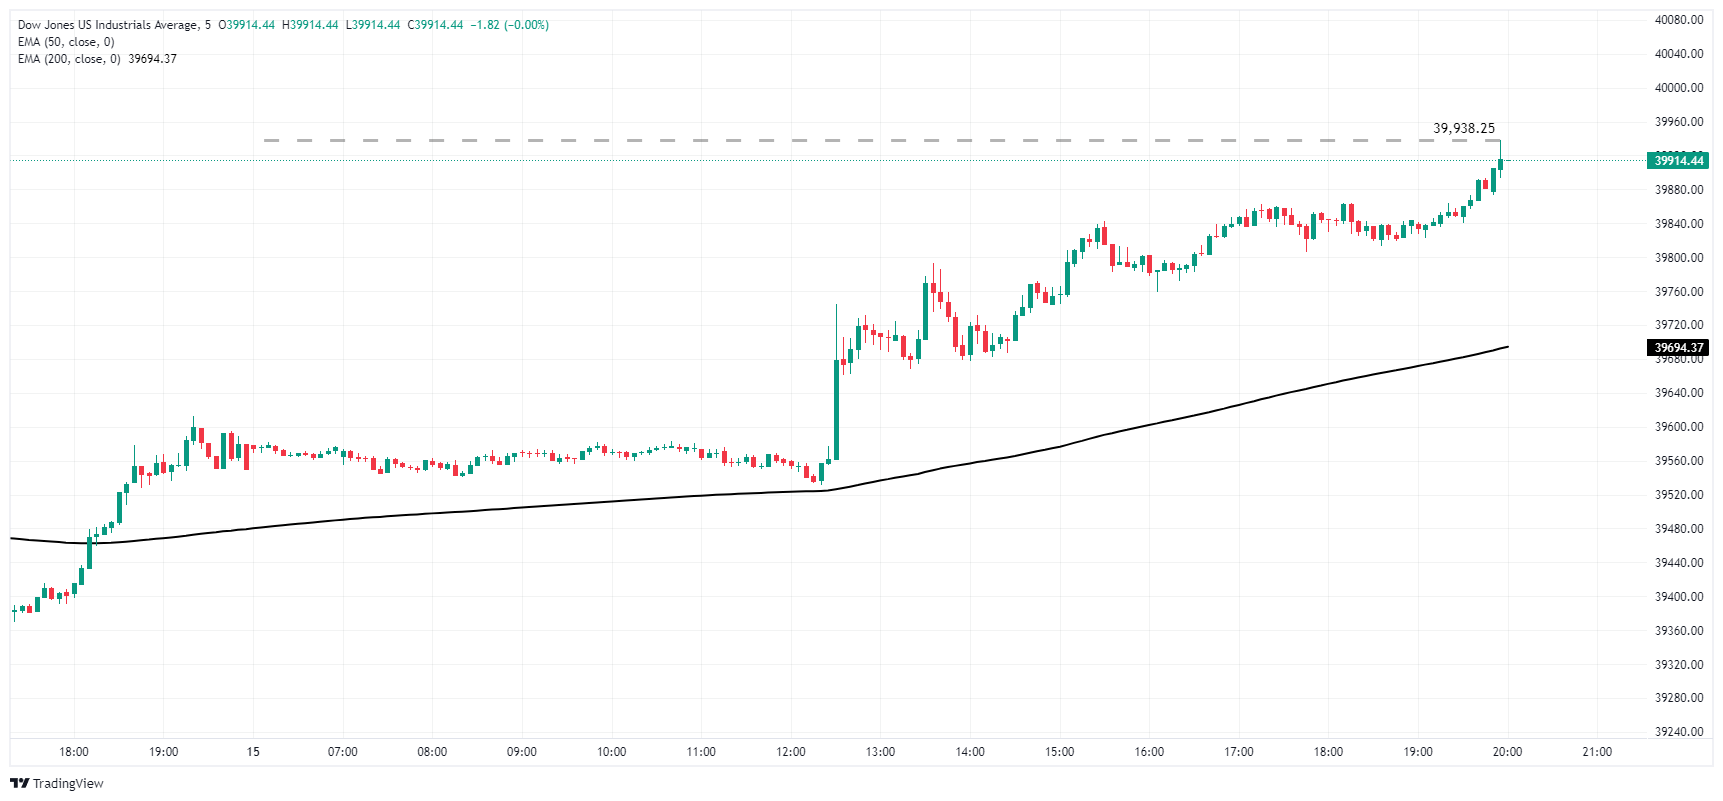
Dow Jones daily chart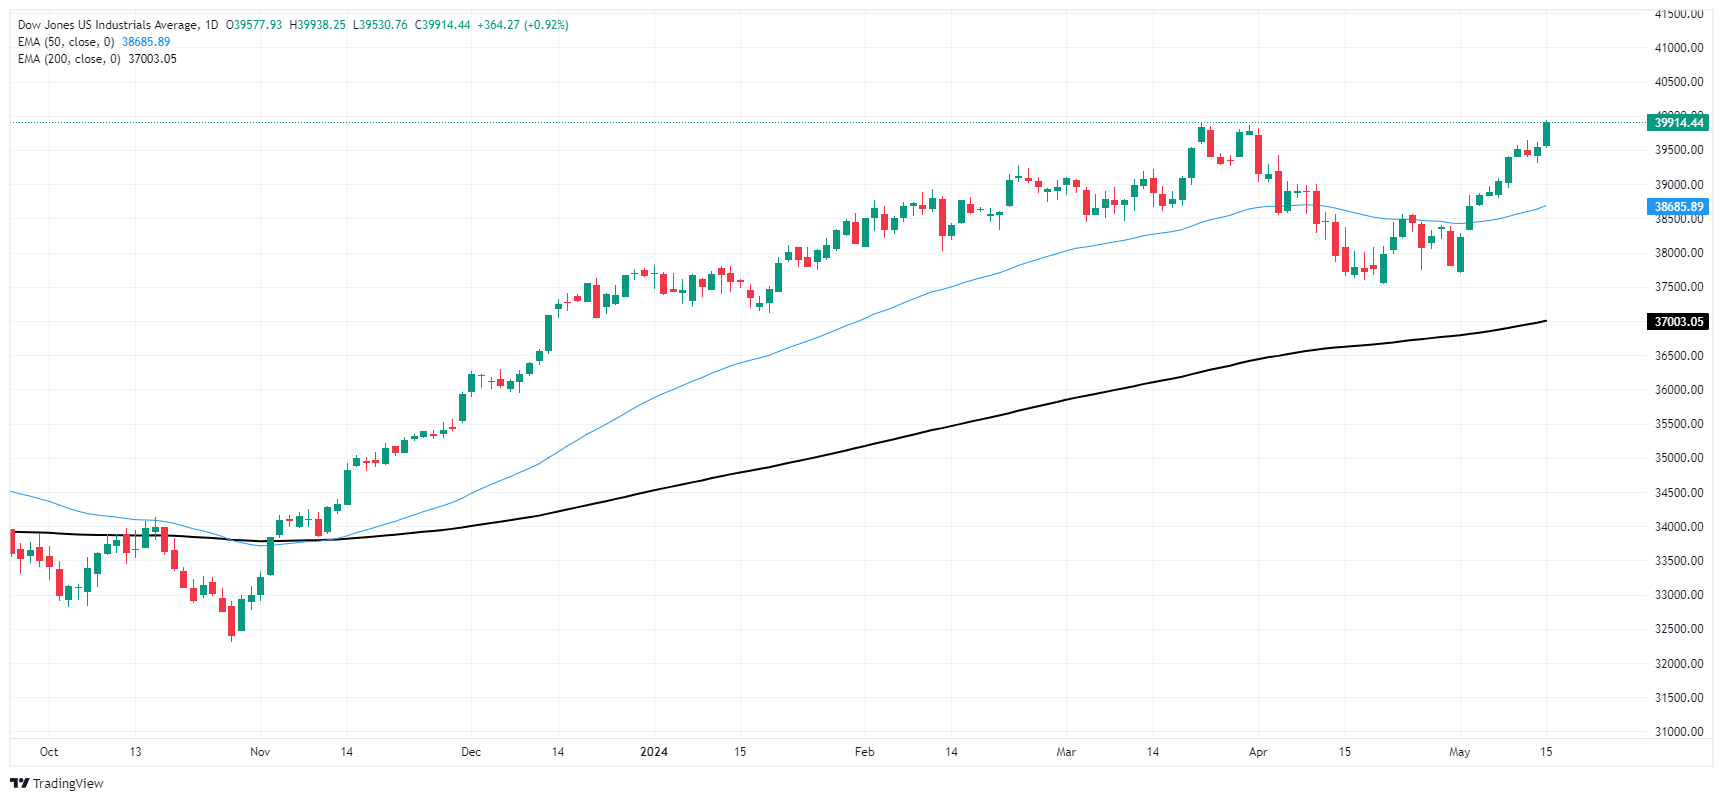
Dow Jones FAQs
The Dow Jones Industrial Average, one of the oldest stock market indices in the world, is compiled of the 30 most traded stocks in the US. The index is price-weighted rather than weighted by capitalization. It is calculated by summing the prices of the constituent stocks and dividing them by a factor, currently 0.152. The index was founded by Charles Dow, who also founded the Wall Street Journal. In later years it has been criticized for not being broadly representative enough because it only tracks 30 conglomerates, unlike broader indices such as the S&P 500.
Many different factors drive the Dow Jones Industrial Average (DJIA). The aggregate performance of the component companies revealed in quarterly company earnings reports is the main one. US and global macroeconomic data also contributes as it impacts on investor sentiment. The level of interest rates, set by the Federal Reserve (Fed), also influences the DJIA as it affects the cost of credit, on which many corporations are heavily reliant. Therefore, inflation can be a major driver as well as other metrics which impact the Fed decisions.
Dow Theory is a method for identifying the primary trend of the stock market developed by Charles Dow. A key step is to compare the direction of the Dow Jones Industrial Average (DJIA) and the Dow Jones Transportation Average (DJTA) and only follow trends where both are moving in the same direction. Volume is a confirmatory criteria. The theory uses elements of peak and trough analysis. Dow’s theory posits three trend phases: accumulation, when smart money starts buying or selling; public participation, when the wider public joins in; and distribution, when the smart money exits.
There are a number of ways to trade the DJIA. One is to use ETFs which allow investors to trade the DJIA as a single security, rather than having to buy shares in all 30 constituent companies. A leading example is the SPDR Dow Jones Industrial Average ETF (DIA). DJIA futures contracts enable traders to speculate on the future value of the index and Options provide the right, but not the obligation, to buy or sell the index at a predetermined price in the future. Mutual funds enable investors to buy a share of a diversified portfolio of DJIA stocks thus providing exposure to the overall index.
Information on these pages contains forward-looking statements that involve risks and uncertainties. Markets and instruments profiled on this page are for informational purposes only and should not in any way come across as a recommendation to buy or sell in these assets. You should do your own thorough research before making any investment decisions. FXStreet does not in any way guarantee that this information is free from mistakes, errors, or material misstatements. It also does not guarantee that this information is of a timely nature. Investing in Open Markets involves a great deal of risk, including the loss of all or a portion of your investment, as well as emotional distress. All risks, losses and costs associated with investing, including total loss of principal, are your responsibility. The views and opinions expressed in this article are those of the authors and do not necessarily reflect the official policy or position of FXStreet nor its advertisers. The author will not be held responsible for information that is found at the end of links posted on this page.
If not otherwise explicitly mentioned in the body of the article, at the time of writing, the author has no position in any stock mentioned in this article and no business relationship with any company mentioned. The author has not received compensation for writing this article, other than from FXStreet.
FXStreet and the author do not provide personalized recommendations. The author makes no representations as to the accuracy, completeness, or suitability of this information. FXStreet and the author will not be liable for any errors, omissions or any losses, injuries or damages arising from this information and its display or use. Errors and omissions excepted.
The author and FXStreet are not registered investment advisors and nothing in this article is intended to be investment advice.
Recommended content
Editors’ Picks
EUR/USD clings to gains above 1.0850 after US inflation data

EUR/USD trades in positive territory above 1.0850 in the American session on Friday. The US Dollar struggles to preserve its strength following the April PCE inflation data and helps the pair hold its ground heading into the weekend.
GBP/USD retreats from 1.2765, holds on to modest gains

GBP/USD posted a two-day high peat at 1.2765 in the American session, as US data showed that the core PCE inflation held steady at 2.8% on a yearly basis in April. The pair retreated afterwards as risk aversion triggered US Dollar demand.
Gold falls towards $2,330 as the mood sours

US inflation-related data took its toll on financial markets. Wall Street turned south after the opening and without signs of easing price pressures in the world’s largest economy. The US Dollar takes the lead in a risk-averse environment.
Here’s why Chainlink price could crash 15% despite spike in social volume Premium

Chainlink price has flashed multiple sell signals after its recent climb, hinting at a short-term correction. This signal comes despite a double-digit growth in its social volume. LINK bulls need to exercise caution as this forecast is backed by on-chain metrics.
Week ahead – ECB rate cut might get eclipsed by BoC surprise and NFP report

ECB set to slash rates on Thursday, focus on forward guidance. But will the BoC take the lead when it meets on Wednesday? US jobs report eyed on Friday as Fed unyielding on cuts. OPEC+ might extend some output reductions into 2025.