
 Yahoo Finance
 Boot Barn (BOOT) Q4 Earnings Beat, Same-Store Sales Fall Y/Y
Boot Barn Holdings, Inc. BOOT came up with fourth-quarter fiscal 2024 results, wherein both revenues and earnings beat the Zacks Consensus Estimate. However, the top and bottom lines declined year over year. The company faced soft same-store sales, e-commerce hurdles and a tough operational landscape in the reported quarteer.
Nonetheless, the company emphasizes operational efficiency and cost management, focusing on optimizing supply-chain operations and maintaining careful inventory management to align with fluctuating sales trends and consumer demands. The expansion of its retail footprint remains central to its growth strategy, with a targeted approach to opening new stores in strategic markets. It opened 55 new stores in fiscal 2024, exceeding original plans.
Boot Barn Holdings, Inc. Price, Consensus and EPS Surprise
Boot Barn Holdings, Inc. price-consensus-eps-surprise-chart | Boot Barn Holdings, Inc. Quote
Q4 in Detail
Boot Barn’s adjusted earnings of $1.01 per share declined 34% from $1.53 reported in the year-ago quarter. Yet, the metric beat the Zacks Consensus Estimate of 89 cents.
Sales of $388.5 million tumbled 8.7% year over year. However, this metric surpassed the Zacks Consensus Estimate of $384 million. The reduction in net sales stemmed from a dip in consolidated same store sales and the effect of having a 13-week quarter compared with a 14-week quarter in the previous year. This was somewhat mitigated by the additional sales from new stores opened in the past twelve months.
Same-store sales declined 5.9% year over year in the fiscal fourth quarter. Retail store same-store sales and e-commerce same-store sales fell 5.7% and 7.6%, respectively.
Gross profit decreased 10.5% to $139.4 million. Gross profit fell mainly due to a decline in sales partially mitigated by an expansion in merchandise margins.
Gross margin contracted 70 basis points (bps) to 35.9% due to a 230 bps increase in expenses related to buying, occupancy and distribution center costs. This was partially compensated by a 160 bps improvement in the merchandise margin. The rise in merchandise margin was fueled by a 160 bps enhancement in freight expense and supply-chain efficiencies relative to net sales.
The increase in buying, occupancy and distribution center costs was primarily due to higher occupancy expenses from new stores and depreciation expenses associated with the opening of the new Kansas City distribution center.
SG&A expenses increased to $101.2 million in the reported quarter, up 8.7% year over year. As a percentage of sales, SG&A expense of 26.1% rose 420 bps year over year. The increase reflected higher marketing expenses, normalized incentive-based compensation compared with a reversal in the prior period, a $2.0 million partial impairment of the Sheplers’ trademark, elevated store labor costs and the effect of a 13-week quarter relative to a 14-week quarter in the previous year.
Operating income decreased 39% to $38.2 million. The operating margin of 9.8% contracted 490 bps from 14.7% last year.
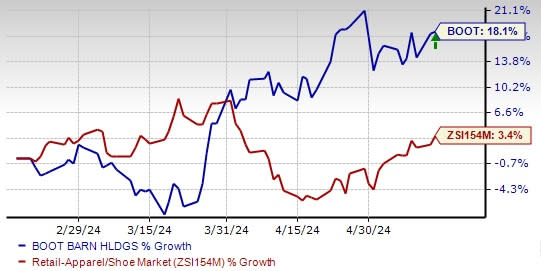
Image Source: Zacks Investment Research
Other Financial Details
BOOT ended the quarter with $75.8 million in cash and cash equivalents. Notably, the company did not draw any funds from its $250 million revolving credit facility during the quarter. Average inventory per store increased approximately 1% on a same-store basis compared with Apr 1, 2023.
Guidance
For the first quarter of fiscal 2025, Boot Barn estimates net sales in the $399-$407 million band, indicating growth of 4-6.1% from the year-ago levels.
The company expects same-store sales to decline in the range of 2.5-4.5%. Retail store same-store sales are forecast to decrease in the 3-5% band and e-commerce same-store sales are likely to be flat to up 2%. Operating income is estimated to be between $38.7 million and $41.2 million, implying to represent about 9.7-10.1% of sales. Earnings are projected in the range of 94 cents-$1.00 per share.
For fiscal 2025, management expects to open 60 stores. It now foresees total revenues to be between $1.766 billion and $1.800 billion, indicating growth of 5.9-8% from the year-ago levels.
BOOT suggests same-store sales to decline in the band of 1.6-3.6%. Retail store same-store sales are anticipated to dip 2-4% and e-commerce same-store sales to inch down 0.5% to up 2%.
Gross profit is envisioned to be between $647.2 million and $664.1 million, suggesting to represent approximately 36.6-36.9% of sales. Selling, general and administrative expenses are expected to be between $458.9 million and $463.4 million. The metric is likely to be about 26-25.7% of sales.
Income from operations is projected to be between $188.3 million and $200.7 million, or about 10.7-11.2% of sales. The effective tax rate is estimated to be 26.2%. Earnings are projected in the range of $4.55-$4.85 per share.
Capital expenditures are forecast to be between $115 million and $120 million, which is net of estimated landlord tenant allowances of $30.2 million.
Shares of this Zacks Rank #3 (Hold) company have gained 18.1% compared with the industry’s growth of 3.4% in past three months.
Key Picks
Some better-ranked stocks in the same space are The Gap, Inc. GPS, Skechers U.S.A., Inc. SKX and Abercrombie & Fitch Co. ANF.
The Gap is a premier international specialty retailer offering a diverse range of clothing, accessories and personal care products. It sports a Zacks Rank #1 (Strong Buy) at present. You can see the complete list of today’s Zacks #1 Rank stocks here.
The Zacks Consensus Estimate for GPS’ current fiscal-year earnings and sales indicates a decline of 0.3% and 4.9%, respectively, from the year-ago reported figures. GPS has a trailing four-quarter average earnings surprise of 180.9%.
Skechers designs, develops, markets and distributes footwear for men, women and children. It currently flaunts a Zacks Rank #1.
The Zacks Consensus Estimate for Skechers’ current financial-year earnings and sales indicates growth of 15.2% and 10.3%, respectively, from the year-earlier levels. SKX has a trailing four-quarter average earnings surprise of 34.1%.
Abercrombie is a specialty retailer of premium, high-quality casual apparel. It currently has a Zacks Rank of 2 (Buy). ANF has a trailing four-quarter average earnings surprise of 715.6%.
The Zacks Consensus Estimate for Abercrombie’s current fiscal-year earnings and sales indicates growth of 20.1% and 5.9%, respectively, from the prior-year actuals.
Want the latest recommendations from Zacks Investment Research? Today, you can download 7 Best Stocks for the Next 30 Days. Click to get this free report
Abercrombie & Fitch Company (ANF) : Free Stock Analysis Report
Skechers U.S.A., Inc. (SKX) : Free Stock Analysis Report
The Gap, Inc. (GPS) : Free Stock Analysis Report
Boot Barn Holdings, Inc. (BOOT) : Free Stock Analysis Report
