
Investigating Visa's Standing In Financial Services Industry Compared To Competitors
Investigating Visa's Standing In Financial Services Industry Compared To Competitors
In today's rapidly changing and highly competitive business world, it is imperative for investors and industry observers to carefully assess companies before making investment choices. In this article, we will undertake a comprehensive industry comparison, evaluating Visa (NYSE:V) vis-à-vis its key competitors in the Financial Services industry. Through a detailed analysis of important financial indicators, market standing, and growth potential, our goal is to provide valuable insights and highlight company's performance in the industry.
在當今瞬息萬變且競爭激烈的商業世界中,投資者和行業觀察家在做出投資選擇之前必須仔細評估公司。在本文中,我們將進行全面的行業比較,評估 簽證(紐約證券交易所:V) 與其在金融服務行業的主要競爭對手相比。通過對重要財務指標、市場地位和增長潛力的詳細分析,我們的目標是提供有價值的見解並突出公司在行業中的表現。
Visa Background
簽證背景
Visa is the largest payment processor in the world. In fiscal 2022, it processed over $14 trillion in total volume. Visa operates in over 200 countries and processes transactions in over 160 currencies. Its systems are capable of processing over 65,000 transactions per second.
Visa是世界上最大的支付處理商。在2022財年,它處理的總交易量超過14萬億美元。Visa在全球200多個國家開展業務,處理超過160種貨幣的交易。它的系統每秒能夠處理超過65,000筆交易。
| Company | P/E | P/B | P/S | ROE | EBITDA (in billions) | Gross Profit (in billions) | Revenue Growth |
|---|---|---|---|---|---|---|---|
| Visa Inc | 31.25 | 14.47 | 16.83 | 11.86% | $5.84 | $6.98 | 9.89% |
| Mastercard Inc | 36.39 | 58.75 | 16.76 | 42.49% | $3.92 | $4.83 | 10.44% |
| Fiserv Inc | 28.75 | 3.11 | 4.79 | 2.51% | $1.96 | $2.88 | 7.39% |
| PayPal Holdings Inc | 16.11 | 3.23 | 2.29 | 4.25% | $1.56 | $3.46 | 9.36% |
| Block Inc | 116.23 | 2.27 | 1.88 | 2.51% | $0.51 | $2.09 | 19.38% |
| Fidelity National Information Services Inc | 105.21 | 2.34 | 4.50 | 3.9% | $0.8 | $0.92 | 2.92% |
| Global Payments Inc | 21.75 | 1.26 | 2.91 | 1.39% | $0.95 | $1.5 | 5.57% |
| Corpay Inc | 21.39 | 6.21 | 5.62 | 7.03% | $0.48 | $0.73 | 3.76% |
| Jack Henry & Associates Inc | 32.32 | 6.87 | 5.59 | 4.97% | $0.17 | $0.21 | 5.9% |
| WEX Inc | 33.52 | 4.86 | 3.42 | 3.66% | $0.23 | $0.39 | 6.65% |
| Euronet Worldwide Inc | 20.15 | 4.21 | 1.54 | 2.1% | $0.09 | $0.32 | 8.87% |
| StoneCo Ltd | 18.07 | 1.81 | 2.41 | 4.53% | $1.13 | $2.3 | 20.35% |
| The Western Union Co | 7.91 | 11.37 | 1.11 | 32.55% | $0.24 | $0.41 | 1.18% |
| Shift4 Payments Inc | 43.82 | 6.21 | 1.49 | 3.1% | $0.1 | $0.19 | 29.32% |
| PagSeguro Digital Ltd | 12.77 | 1.55 | 2.34 | 3.74% | $1.79 | $0.2 | 5.94% |
| DLocal Ltd | 27.39 | 8.52 | 6.25 | 6.44% | $-0.02 | $0.07 | 58.75% |
| Evertec Inc | 37.63 | 4.73 | 3.32 | 2.9% | $0.07 | $0.1 | 28.47% |
| Paymentus Holdings Inc | 80.61 | 5.24 | 3.58 | 1.66% | $0.02 | $0.05 | 24.64% |
| Payoneer Global Inc | 19.17 | 3.25 | 2.59 | 4.37% | $0.05 | $0.19 | 18.84% |
| Average | 37.73 | 7.54 | 4.02 | 7.45% | $0.78 | $1.16 | 14.87% |
| 公司 | P/E | P/B | 市銷率 | 羅伊 | 息稅折舊攤銷前利潤(單位:十億) | 毛利(單位:十億) | 收入增長 |
|---|---|---|---|---|---|---|---|
| Visa Inc | 31.25 | 14.47 | 16.83 | 11.86% | 5.84 美元 | 6.98 美元 | 9.89% |
| 萬事達卡公司 | 36.39 | 58.75 | 16.76 | 42.49% | 3.92 美元 | 4.83 美元 | 10.44% |
| Fiserv Inc. | 28.75 | 3.11 | 4.79 | 2.51% | 1.96 美元 | 2.88 美元 | 7.39% |
| 貝寶控股公司 | 16.11 | 3.23 | 2.29 | 4.25% | 1.56 | 3.46 美元 | 9.36% |
| Block Inc | 116.23 | 2.27 | 1.88 | 2.51% | 0.51 美元 | 2.09 美元 | 19.38% |
| 富達國家信息服務公司 | 105.21 | 2.34 | 4.50 | 3.9% | 0.8 美元 | 0.92 美元 | 2.92% |
| 全球支付公司 | 21.75 | 1.26 | 2.91 | 1.39% | 0.95 美元 | 1.5 美元 | 5.57% |
| Corpay Inc | 21.39 | 6.21 | 5.62 | 7.03% | 0.48 美元 | 0.73 美元 | 3.76% |
| 傑克·亨利律師事務所 | 32.32 | 6.87 | 5.59 | 4.97% | 0.17 美元 | 0.21 美元 | 5.9% |
| WEX Inc | 33.52 | 4.86 | 3.42 | 3.66% | 0.23 美元 | 0.39 美元 | 6.65% |
| Euronet 全球公司 | 20.15 | 4.21 | 1.54 | 2.1% | 0.09 | 0.32 美元 | 8.87% |
| Stoneco Ltd | 18.07 | 1.81 | 2.41 | 4.53% | 1.13 | 2.3 美元 | 20.35% |
| 西聯匯款公司 | 7.91 | 11.37 | 1.11 | 32.55% | 0.24 美元 | 0.41 美元 | 1.18% |
| Shift4 Payments | 43.82 | 6.21 | 1.49 | 3.1% | 0.1 美元 | 0.19 美元 | 29.32% |
| PagSeguro 數字有限公司 | 12.77 | 1.55 | 2.34 | 3.74% | 1.79 美元 | 0.2 美元 | 5.94% |
| dLocal 有限公司 | 27.39 | 8.52 | 6.25 | 6.44% | -0.02 美元 | 0.07 美元 | 58.75% |
| 埃弗泰克公司 | 37.63 | 4.73 | 3.32 | 2.9% | 0.07 美元 | 0.1 美元 | 28.47% |
| Paymentus 控股公司 | 80.61 | 5.24 | 3.58 | 1.66% | 0.02 | 0.05 美元 | 24.64% |
| Payoneer Global Inc | 19.17 | 3.25 | 2.59 | 4.37% | 0.05 美元 | 0.19 美元 | 18.84% |
| 平均值 | 37.73 | 7.54 | 4.02 | 7.45% | 0.78 美元 | 1.16 美元 | 14.87% |
By carefully studying Visa, we can deduce the following trends:
通過仔細研究Visa,我們可以推斷出以下趨勢:
The Price to Earnings ratio of 31.25 is 0.83x lower than the industry average, indicating potential undervaluation for the stock.
It could be trading at a premium in relation to its book value, as indicated by its Price to Book ratio of 14.47 which exceeds the industry average by 1.92x.
With a relatively high Price to Sales ratio of 16.83, which is 4.19x the industry average, the stock might be considered overvalued based on sales performance.
The Return on Equity (ROE) of 11.86% is 4.41% above the industry average, highlighting efficient use of equity to generate profits.
Compared to its industry, the company has higher Earnings Before Interest, Taxes, Depreciation, and Amortization (EBITDA) of $5.84 Billion, which is 7.49x above the industry average, indicating stronger profitability and robust cash flow generation.
The gross profit of $6.98 Billion is 6.02x above that of its industry, highlighting stronger profitability and higher earnings from its core operations.
The company's revenue growth of 9.89% is significantly below the industry average of 14.87%. This suggests a potential struggle in generating increased sales volume.
的市盈率 31.25 是 0.83x 低於行業平均水平,表明該股的估值可能被低估。
它的交易價格與賬面價值的比率可能相對於其賬面價值溢價,其價格與賬面價值的比率爲 14.47 這比行業平均水平高出了 1.92x。
價格與銷售額的比率相對較高 16.83,這是 4.19x 根據行業平均水平,根據銷售業績,該股可能被視爲被高估了。
的股本回報率 (ROE) 11.86% 是 4.41% 高於行業平均水平,突顯了有效利用股權來創造利潤。
與同行業相比,該公司的扣除利息、稅項、折舊和攤銷前的收益(EBITDA)更高 5.84 億美元,這是 7.49x 高於行業平均水平,表明盈利能力更強,現金流產生強勁。
的毛利潤 6.98 億美元 是 6.02 倍 高於其行業水平,這凸顯了其更強的盈利能力和更高的核心業務收益。
該公司的收入增長爲 9.89% 大大低於行業平均水平 14.87%。這表明在增加銷量方面可能存在困難。
Debt To Equity Ratio
負債權益比率
The debt-to-equity (D/E) ratio gauges the extent to which a company has financed its operations through debt relative to equity.
債務與權益(D/E)比率衡量公司通過債務相對於權益爲其運營融資的程度。
Considering the debt-to-equity ratio in industry comparisons allows for a concise evaluation of a company's financial health and risk profile, aiding in informed decision-making.
在行業比較中考慮債務與權益比率可以對公司的財務狀況和風險狀況進行簡明的評估,從而有助於做出明智的決策。
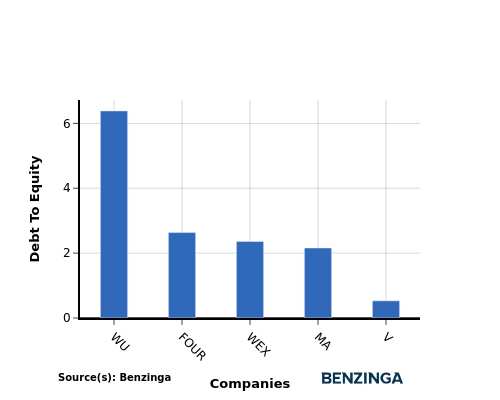
When examining Visa in comparison to its top 4 peers with respect to the Debt-to-Equity ratio, the following information becomes apparent:
在將Visa與前四名同行的債務權益比率進行比較時,以下信息變得顯而易見:
Visa is in a relatively stronger financial position compared to its top 4 peers, as evidenced by its lower debt-to-equity ratio of 0.53.
This implies that the company relies less on debt financing and has a more favorable balance between debt and equity.
與排名前四的同行相比,Visa的財務狀況相對較強,其較低的債務與權益比率就證明了這一點 0.53。
這意味着該公司減少了對債務融資的依賴,在債務和股權之間取得了更有利的平衡。
Key Takeaways
關鍵要點
For Visa, the PE ratio is low compared to peers, indicating potential undervaluation. The high PB and PS ratios suggest strong market sentiment and revenue multiples. In terms of ROE, EBITDA, and gross profit, Visa demonstrates high profitability and operational efficiency. However, the low revenue growth may raise concerns about future performance compared to industry peers in the Financial Services sector.
對於Visa而言,與同行相比,市盈率較低,這表明估值可能被低估。較高的市盈率和市盈率表明強勁的市場情緒和收入倍數。在投資回報率、息稅折舊攤銷前利潤和毛利方面,Visa表現出很高的盈利能力和運營效率。但是,與金融服務行業的同行相比,低收入增長可能會引起人們對未來表現的擔憂。
This article was generated by Benzinga's automated content engine and reviewed by an editor.
本文由Benzinga的自動內容引擎生成,並由編輯審閱。
譯文內容由第三人軟體翻譯。