
UMS Holdings (SGX:558) Sheds 17% This Week, as Yearly Returns Fall More in Line With Earnings Growth
UMS Holdings (SGX:558) Sheds 17% This Week, as Yearly Returns Fall More in Line With Earnings Growth
It might be of some concern to shareholders to see the UMS Holdings Limited (SGX:558) share price down 18% in the last month. But in stark contrast, the returns over the last half decade have impressed. It's fair to say most would be happy with 124% the gain in that time. Generally speaking the long term returns will give you a better idea of business quality than short periods can. Only time will tell if there is still too much optimism currently reflected in the share price.
上個月,UMS控股有限公司(新加坡證券交易所股票代碼:558)的股價下跌了18%,這可能會引起股東的擔憂。但與之形成鮮明對比的是,過去五年的回報給人留下了深刻的印象。可以公平地說,大多數人會對那段時間內124%的漲幅感到滿意。一般而言,與短期回報相比,長期回報將使您更好地了解業務質量。只有時間才能證明目前股價中是否還反映出過多的樂觀情緒。
In light of the stock dropping 17% in the past week, we want to investigate the longer term story, and see if fundamentals have been the driver of the company's positive five-year return.
鑑於該股在過去一週下跌了17%,我們想調查長期情況,看看基本面是否是該公司五年正回報率的驅動力。
While markets are a powerful pricing mechanism, share prices reflect investor sentiment, not just underlying business performance. By comparing earnings per share (EPS) and share price changes over time, we can get a feel for how investor attitudes to a company have morphed over time.
雖然市場是一種強大的定價機制,但股價反映了投資者的情緒,而不僅僅是潛在的業務表現。通過比較每股收益(EPS)和一段時間內的股價變化,我們可以了解投資者對公司的態度是如何隨着時間的推移而變化的。
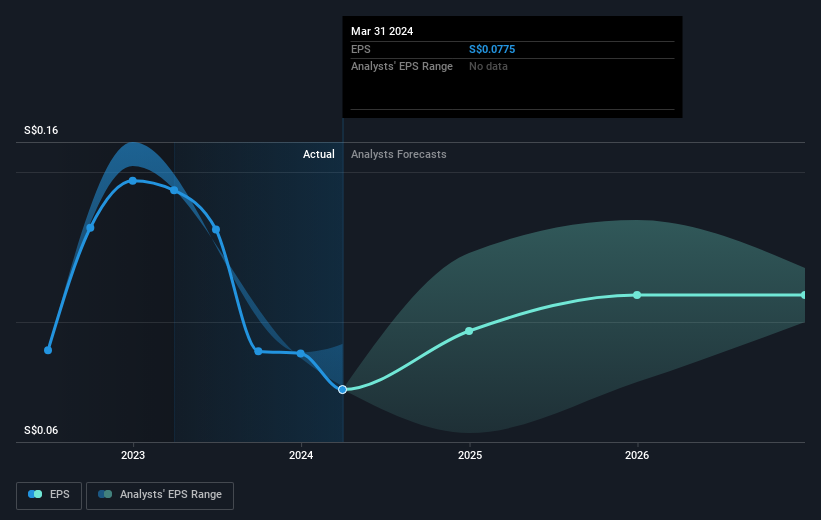
During five years of share price growth, UMS Holdings achieved compound earnings per share (EPS) growth of 5.1% per year. This EPS growth is slower than the share price growth of 17% per year, over the same period. This suggests that market participants hold the company in higher regard, these days. And that's hardly shocking given the track record of growth.
在五年的股價增長中,UMS Holdings實現了每年5.1%的複合每股收益(EPS)增長。每股收益的增長低於同期每年17%的股價增長。這表明,如今,市場參與者對公司的重視程度更高。考慮到增長的記錄,這並不令人震驚。
The graphic below depicts how EPS has changed over time (unveil the exact values by clicking on the image).
下圖描述了 EPS 隨着時間的推移是如何變化的(點擊圖片可以看到確切的值)。
Dive deeper into UMS Holdings' key metrics by checking this interactive graph of UMS Holdings's earnings, revenue and cash flow.
查看這張UMS Holdings收益、收入和現金流的交互式圖表,深入了解UMS Holdings的關鍵指標。
What About Dividends?
分紅呢?
When looking at investment returns, it is important to consider the difference between total shareholder return (TSR) and share price return. The TSR incorporates the value of any spin-offs or discounted capital raisings, along with any dividends, based on the assumption that the dividends are reinvested. So for companies that pay a generous dividend, the TSR is often a lot higher than the share price return. We note that for UMS Holdings the TSR over the last 5 years was 175%, which is better than the share price return mentioned above. This is largely a result of its dividend payments!
在考慮投資回報時,重要的是要考慮兩者之間的區別 股東總回報 (TSR) 和 股價回報。基於股息再投資的假設,股東總回報率納入了任何分拆或貼現資本籌集的價值以及任何股息。因此,對於支付豐厚股息的公司來說,股東總回報率通常遠高於股價回報率。我們注意到,對於UMS Holdings而言,過去5年的股東總回報率爲175%,好於上述股價回報率。這在很大程度上是其股息支付的結果!
A Different Perspective
不同的視角
It's nice to see that UMS Holdings shareholders have received a total shareholder return of 26% over the last year. And that does include the dividend. Since the one-year TSR is better than the five-year TSR (the latter coming in at 22% per year), it would seem that the stock's performance has improved in recent times. Someone with an optimistic perspective could view the recent improvement in TSR as indicating that the business itself is getting better with time. While it is well worth considering the different impacts that market conditions can have on the share price, there are other factors that are even more important. Even so, be aware that UMS Holdings is showing 2 warning signs in our investment analysis , you should know about...
很高興看到UMS Holdings的股東在過去一年中獲得了26%的總股東回報率。這確實包括股息。由於一年期股東總回報率好於五年期股東總回報率(後者爲每年22%),因此該股的表現似乎在最近有所改善。持樂觀態度的人可能會將最近股東總回報率的改善視爲業務本身隨着時間的推移而變得更好。儘管市場狀況可能對股價產生的不同影響值得考慮,但還有其他因素更爲重要。即便如此,請注意,UMS Holdings在我們的投資分析中顯示了兩個警告信號,您應該知道...
For those who like to find winning investments this free list of growing companies with recent insider purchasing, could be just the ticket.
對於那些喜歡尋找中獎投資的人來說,這份最近有內幕收購的成長型公司的免費名單可能只是門票。
Please note, the market returns quoted in this article reflect the market weighted average returns of stocks that currently trade on Singaporean exchanges.
請注意,本文引用的市場回報反映了目前在新加坡交易所交易的股票的市場加權平均回報。
Have feedback on this article? Concerned about the content? Get in touch with us directly. Alternatively, email editorial-team (at) simplywallst.com.
This article by Simply Wall St is general in nature. We provide commentary based on historical data and analyst forecasts only using an unbiased methodology and our articles are not intended to be financial advice. It does not constitute a recommendation to buy or sell any stock, and does not take account of your objectives, or your financial situation. We aim to bring you long-term focused analysis driven by fundamental data. Note that our analysis may not factor in the latest price-sensitive company announcements or qualitative material. Simply Wall St has no position in any stocks mentioned.
對這篇文章有反饋嗎?對內容感到擔憂?直接聯繫我們。 或者,給編輯團隊 (at) simplywallst.com 發送電子郵件。
Simply Wall St的這篇文章本質上是籠統的。我們僅使用公正的方法根據歷史數據和分析師的預測提供評論,我們的文章無意作爲財務建議。它不構成買入或賣出任何股票的建議,也沒有考慮到您的目標或財務狀況。我們的目標是爲您提供由基本數據驅動的長期重點分析。請注意,我們的分析可能不考慮最新的價格敏感型公司公告或定性材料。簡而言之,華爾街沒有持有任何上述股票的頭寸。
譯文內容由第三人軟體翻譯。