
 Yahoo Finance
 Progyny (NASDAQ:PGNY) Has More To Do To Multiply In Value Going Forward
Did you know there are some financial metrics that can provide clues of a potential multi-bagger? Firstly, we'll want to see a proven return on capital employed (ROCE) that is increasing, and secondly, an expanding base of capital employed. This shows us that it's a compounding machine, able to continually reinvest its earnings back into the business and generate higher returns. So, when we ran our eye over Progyny's (NASDAQ:PGNY) trend of ROCE, we liked what we saw.
Understanding Return On Capital Employed (ROCE)
For those who don't know, ROCE is a measure of a company's yearly pre-tax profit (its return), relative to the capital employed in the business. To calculate this metric for Progyny, this is the formula:
Return on Capital Employed = Earnings Before Interest and Tax (EBIT) ÷ (Total Assets - Current Liabilities)
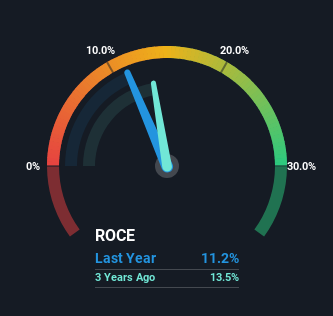
0.11 = US$66m ÷ (US$794m - US$206m) (Based on the trailing twelve months to March 2024).
Thus, Progyny has an ROCE of 11%. That's a pretty standard return and it's in line with the industry average of 11%.
See our latest analysis for Progyny
In the above chart we have measured Progyny's prior ROCE against its prior performance, but the future is arguably more important. If you'd like, you can check out the forecasts from the analysts covering Progyny for free.
What Does the ROCE Trend For Progyny Tell Us?
The trend of ROCE doesn't stand out much, but returns on a whole are decent. The company has consistently earned 11% for the last five years, and the capital employed within the business has risen 4,055% in that time. Since 11% is a moderate ROCE though, it's good to see a business can continue to reinvest at these decent rates of return. Stable returns in this ballpark can be unexciting, but if they can be maintained over the long run, they often provide nice rewards to shareholders.
On a side note, Progyny has done well to reduce current liabilities to 26% of total assets over the last five years. Effectively suppliers now fund less of the business, which can lower some elements of risk.
Our Take On Progyny's ROCE
To sum it up, Progyny has simply been reinvesting capital steadily, at those decent rates of return. However, despite the favorable fundamentals, the stock has fallen 48% over the last three years, so there might be an opportunity here for astute investors. That's why we think it'd be worthwhile to look further into this stock given the fundamentals are appealing.
While Progyny doesn't shine too bright in this respect, it's still worth seeing if the company is trading at attractive prices. You can find that out with our FREE intrinsic value estimation for PGNY on our platform.
While Progyny isn't earning the highest return, check out this free list of companies that are earning high returns on equity with solid balance sheets.
Have feedback on this article? Concerned about the content? Get in touch with us directly. Alternatively, email editorial-team (at) simplywallst.com.
This article by Simply Wall St is general in nature. We provide commentary based on historical data and analyst forecasts only using an unbiased methodology and our articles are not intended to be financial advice. It does not constitute a recommendation to buy or sell any stock, and does not take account of your objectives, or your financial situation. We aim to bring you long-term focused analysis driven by fundamental data. Note that our analysis may not factor in the latest price-sensitive company announcements or qualitative material. Simply Wall St has no position in any stocks mentioned.
