
 Yahoo Finance
 Returns On Capital Signal Tricky Times Ahead For Powerwell Holdings Berhad (KLSE:PWRWELL)
Did you know there are some financial metrics that can provide clues of a potential multi-bagger? Ideally, a business will show two trends; firstly a growing return on capital employed (ROCE) and secondly, an increasing amount of capital employed. This shows us that it's a compounding machine, able to continually reinvest its earnings back into the business and generate higher returns. So when we looked at Powerwell Holdings Berhad (KLSE:PWRWELL), they do have a high ROCE, but we weren't exactly elated from how returns are trending.
What Is Return On Capital Employed (ROCE)?
For those who don't know, ROCE is a measure of a company's yearly pre-tax profit (its return), relative to the capital employed in the business. To calculate this metric for Powerwell Holdings Berhad, this is the formula:
Return on Capital Employed = Earnings Before Interest and Tax (EBIT) ÷ (Total Assets - Current Liabilities)
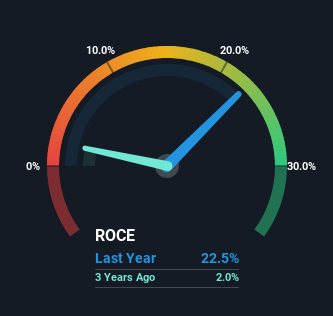
0.22 = RM21m ÷ (RM174m - RM80m) (Based on the trailing twelve months to December 2023).
Thus, Powerwell Holdings Berhad has an ROCE of 22%. That's a fantastic return and not only that, it outpaces the average of 11% earned by companies in a similar industry.
View our latest analysis for Powerwell Holdings Berhad
In the above chart we have measured Powerwell Holdings Berhad's prior ROCE against its prior performance, but the future is arguably more important. If you'd like to see what analysts are forecasting going forward, you should check out our free analyst report for Powerwell Holdings Berhad .
So How Is Powerwell Holdings Berhad's ROCE Trending?
When we looked at the ROCE trend at Powerwell Holdings Berhad, we didn't gain much confidence. To be more specific, while the ROCE is still high, it's fallen from 30% where it was five years ago. Although, given both revenue and the amount of assets employed in the business have increased, it could suggest the company is investing in growth, and the extra capital has led to a short-term reduction in ROCE. If these investments prove successful, this can bode very well for long term stock performance.
On a side note, Powerwell Holdings Berhad's current liabilities are still rather high at 46% of total assets. This can bring about some risks because the company is basically operating with a rather large reliance on its suppliers or other sorts of short-term creditors. While it's not necessarily a bad thing, it can be beneficial if this ratio is lower.
The Bottom Line On Powerwell Holdings Berhad's ROCE
While returns have fallen for Powerwell Holdings Berhad in recent times, we're encouraged to see that sales are growing and that the business is reinvesting in its operations. Furthermore the stock has climbed 84% over the last three years, it would appear that investors are upbeat about the future. So while investors seem to be recognizing these promising trends, we would look further into this stock to make sure the other metrics justify the positive view.
One more thing, we've spotted 3 warning signs facing Powerwell Holdings Berhad that you might find interesting.
High returns are a key ingredient to strong performance, so check out our free list ofstocks earning high returns on equity with solid balance sheets.
Have feedback on this article? Concerned about the content? Get in touch with us directly. Alternatively, email editorial-team (at) simplywallst.com.
This article by Simply Wall St is general in nature. We provide commentary based on historical data and analyst forecasts only using an unbiased methodology and our articles are not intended to be financial advice. It does not constitute a recommendation to buy or sell any stock, and does not take account of your objectives, or your financial situation. We aim to bring you long-term focused analysis driven by fundamental data. Note that our analysis may not factor in the latest price-sensitive company announcements or qualitative material. Simply Wall St has no position in any stocks mentioned.
