
 Yahoo Finance
 Top Glove Corporation Bhd.'s (KLSE:TOPGLOV) 6.1% gain last week benefited both individual investors who own 38% as well as insiders
Key Insights
Significant control over Top Glove Corporation Bhd by individual investors implies that the general public has more power to influence management and governance-related decisions
The top 8 shareholders own 51% of the company
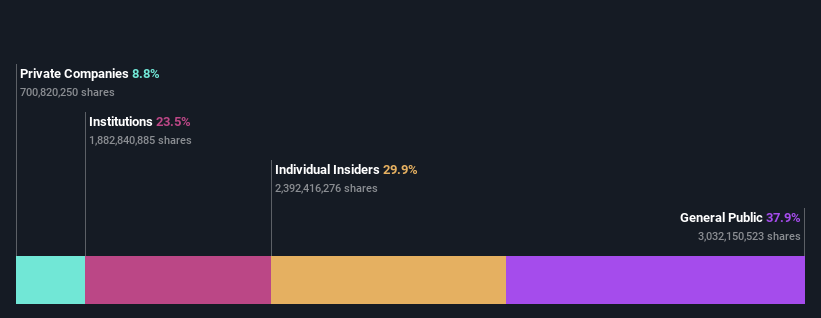
If you want to know who really controls Top Glove Corporation Bhd. (KLSE:TOPGLOV), then you'll have to look at the makeup of its share registry. The group holding the most number of shares in the company, around 38% to be precise, is individual investors. That is, the group stands to benefit the most if the stock rises (or lose the most if there is a downturn).
While individual investors were the group that reaped the most benefits after last week’s 6.1% price gain, insiders also received a 30% cut.
Let's delve deeper into each type of owner of Top Glove Corporation Bhd, beginning with the chart below.
View our latest analysis for Top Glove Corporation Bhd
What Does The Institutional Ownership Tell Us About Top Glove Corporation Bhd?
Institutions typically measure themselves against a benchmark when reporting to their own investors, so they often become more enthusiastic about a stock once it's included in a major index. We would expect most companies to have some institutions on the register, especially if they are growing.
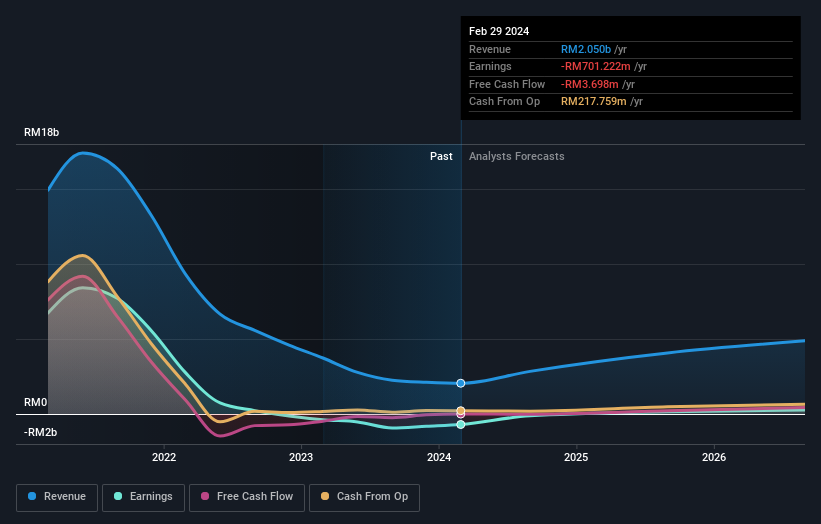
As you can see, institutional investors have a fair amount of stake in Top Glove Corporation Bhd. This implies the analysts working for those institutions have looked at the stock and they like it. But just like anyone else, they could be wrong. It is not uncommon to see a big share price drop if two large institutional investors try to sell out of a stock at the same time. So it is worth checking the past earnings trajectory of Top Glove Corporation Bhd, (below). Of course, keep in mind that there are other factors to consider, too.
Top Glove Corporation Bhd is not owned by hedge funds. From our data, we infer that the largest shareholder is Wee Chai Lim (who also holds the title of Top Key Executive) with 28% of shares outstanding. Its usually considered a good sign when insiders own a significant number of shares in the company, and in this case, we're glad to see a company insider play the role of a key stakeholder. In comparison, the second and third largest shareholders hold about 6.9% and 5.9% of the stock.
We did some more digging and found that 8 of the top shareholders account for roughly 51% of the register, implying that along with larger shareholders, there are a few smaller shareholders, thereby balancing out each others interests somewhat.
While it makes sense to study institutional ownership data for a company, it also makes sense to study analyst sentiments to know which way the wind is blowing. There are plenty of analysts covering the stock, so it might be worth seeing what they are forecasting, too.
Insider Ownership Of Top Glove Corporation Bhd
The definition of an insider can differ slightly between different countries, but members of the board of directors always count. Management ultimately answers to the board. However, it is not uncommon for managers to be executive board members, especially if they are a founder or the CEO.
Insider ownership is positive when it signals leadership are thinking like the true owners of the company. However, high insider ownership can also give immense power to a small group within the company. This can be negative in some circumstances.
Our information suggests that insiders maintain a significant holding in Top Glove Corporation Bhd.. It has a market capitalization of just RM7.6b, and insiders have RM2.3b worth of shares in their own names. That's quite significant. It is good to see this level of investment. You can check here to see if those insiders have been buying recently.
General Public Ownership
The general public-- including retail investors -- own 38% stake in the company, and hence can't easily be ignored. While this size of ownership may not be enough to sway a policy decision in their favour, they can still make a collective impact on company policies.
Private Company Ownership
Our data indicates that Private Companies hold 8.8%, of the company's shares. Private companies may be related parties. Sometimes insiders have an interest in a public company through a holding in a private company, rather than in their own capacity as an individual. While it's hard to draw any broad stroke conclusions, it is worth noting as an area for further research.
Next Steps:
While it is well worth considering the different groups that own a company, there are other factors that are even more important.
I always like to check for a history of revenue growth. You can too, by accessing this free chart of historic revenue and earnings in this detailed graph.
But ultimately it is the future, not the past, that will determine how well the owners of this business will do. Therefore we think it advisable to take a look at this free report showing whether analysts are predicting a brighter future.
NB: Figures in this article are calculated using data from the last twelve months, which refer to the 12-month period ending on the last date of the month the financial statement is dated. This may not be consistent with full year annual report figures.
Have feedback on this article? Concerned about the content? Get in touch with us directly. Alternatively, email editorial-team (at) simplywallst.com.
This article by Simply Wall St is general in nature. We provide commentary based on historical data and analyst forecasts only using an unbiased methodology and our articles are not intended to be financial advice. It does not constitute a recommendation to buy or sell any stock, and does not take account of your objectives, or your financial situation. We aim to bring you long-term focused analysis driven by fundamental data. Note that our analysis may not factor in the latest price-sensitive company announcements or qualitative material. Simply Wall St has no position in any stocks mentioned.
