Has Techna-X Berhad's (KLSE:TECHNAX) Impressive Stock Performance Got Anything to Do With Its Fundamentals?
Techna-X Berhad's (KLSE:TECHNAX) stock is up by a considerable 1,167% over the past week. As most would know, fundamentals are what usually guide market price movements over the long-term, so we decided to look at the company's key financial indicators today to determine if they have any role to play in the recent price movement. Specifically, we decided to study Techna-X Berhad's ROE in this article.
Return on equity or ROE is a key measure used to assess how efficiently a company's management is utilizing the company's capital. Put another way, it reveals the company's success at turning shareholder investments into profits.
See our latest analysis for Techna-X Berhad
How Is ROE Calculated?
The formula for return on equity is:
Return on Equity = Net Profit (from continuing operations) ÷ Shareholders' Equity
So, based on the above formula, the ROE for Techna-X Berhad is:
6.4% = RM2.9m ÷ RM45m (Based on the trailing twelve months to December 2023).
The 'return' is the profit over the last twelve months. One way to conceptualize this is that for each MYR1 of shareholders' capital it has, the company made MYR0.06 in profit.
What Is The Relationship Between ROE And Earnings Growth?
We have already established that ROE serves as an efficient profit-generating gauge for a company's future earnings. Depending on how much of these profits the company reinvests or "retains", and how effectively it does so, we are then able to assess a company’s earnings growth potential. Assuming all else is equal, companies that have both a higher return on equity and higher profit retention are usually the ones that have a higher growth rate when compared to companies that don't have the same features.
Techna-X Berhad's Earnings Growth And 6.4% ROE
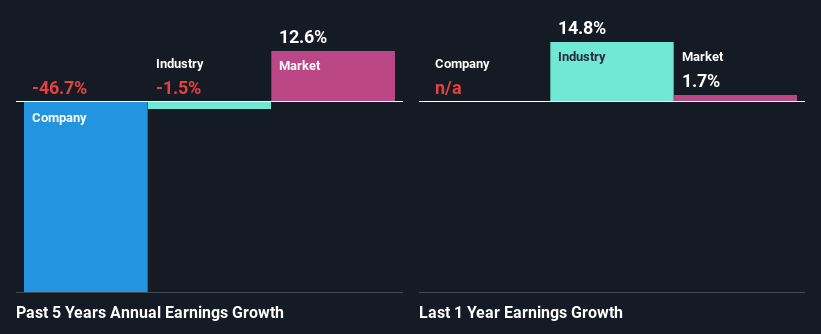
On the face of it, Techna-X Berhad's ROE is not much to talk about. Although a closer study shows that the company's ROE is higher than the industry average of 3.9% which we definitely can't overlook. But then again, seeing that Techna-X Berhad's net income shrunk at a rate of 47% in the past five years, makes us think again. Remember, the company's ROE is a bit low to begin with, just that it is higher than the industry average. Hence, this goes some way in explaining the shrinking earnings.
As a next step, we compared Techna-X Berhad's performance with the industry and found thatTechna-X Berhad's performance is depressing even when compared with the industry, which has shrunk its earnings at a rate of 1.5% in the same period, which is a slower than the company.
The basis for attaching value to a company is, to a great extent, tied to its earnings growth. The investor should try to establish if the expected growth or decline in earnings, whichever the case may be, is priced in. This then helps them determine if the stock is placed for a bright or bleak future. Is Techna-X Berhad fairly valued compared to other companies? These 3 valuation measures might help you decide.
Is Techna-X Berhad Efficiently Re-investing Its Profits?
Because Techna-X Berhad doesn't pay any regular dividends, we infer that it is retaining all of its profits, which is rather perplexing when you consider the fact that there is no earnings growth to show for it. So there might be other factors at play here which could potentially be hampering growth. For example, the business has faced some headwinds.
Conclusion
Overall, we feel that Techna-X Berhad certainly does have some positive factors to consider. Although, we are disappointed to see a lack of growth in earnings even in spite of a moderate ROE and and a high reinvestment rate. We believe that there might be some outside factors that could be having a negative impact on the business. While we won't completely dismiss the company, what we would do, is try to ascertain how risky the business is to make a more informed decision around the company. To know the 2 risks we have identified for Techna-X Berhad visit our risks dashboard for free.
Have feedback on this article? Concerned about the content? Get in touch with us directly. Alternatively, email editorial-team (at) simplywallst.com.
This article by Simply Wall St is general in nature. We provide commentary based on historical data and analyst forecasts only using an unbiased methodology and our articles are not intended to be financial advice. It does not constitute a recommendation to buy or sell any stock, and does not take account of your objectives, or your financial situation. We aim to bring you long-term focused analysis driven by fundamental data. Note that our analysis may not factor in the latest price-sensitive company announcements or qualitative material. Simply Wall St has no position in any stocks mentioned.
