
Investing in Lululemon Athletica (NASDAQ:LULU) Five Years Ago Would Have Delivered You a 100% Gain
Investing in Lululemon Athletica (NASDAQ:LULU) Five Years Ago Would Have Delivered You a 100% Gain
It hasn't been the best quarter for Lululemon Athletica Inc. (NASDAQ:LULU) shareholders, since the share price has fallen 27% in that time. On the other hand the returns over the last half decade have not been bad. It's good to see the share price is up 100% in that time, better than its market return of 93%.
對於Lululemon Athletica Inc.(納斯達克股票代碼:LULU)股東來說,這並不是最好的季度,因爲當時股價已經下跌了27%。另一方面,過去五年的回報並不差。很高興看到股價在此期間上漲了100%,好於其93%的市場回報率。
So let's assess the underlying fundamentals over the last 5 years and see if they've moved in lock-step with shareholder returns.
因此,讓我們評估過去5年的基本面,看看它們是否與股東回報步調一致。
While the efficient markets hypothesis continues to be taught by some, it has been proven that markets are over-reactive dynamic systems, and investors are not always rational. By comparing earnings per share (EPS) and share price changes over time, we can get a feel for how investor attitudes to a company have morphed over time.
儘管一些人繼續教導高效市場假說,但事實證明,市場是反應過度的動態系統,投資者並不總是理性的。通過比較每股收益(EPS)和一段時間內的股價變化,我們可以了解投資者對公司的態度是如何隨着時間的推移而變化的。
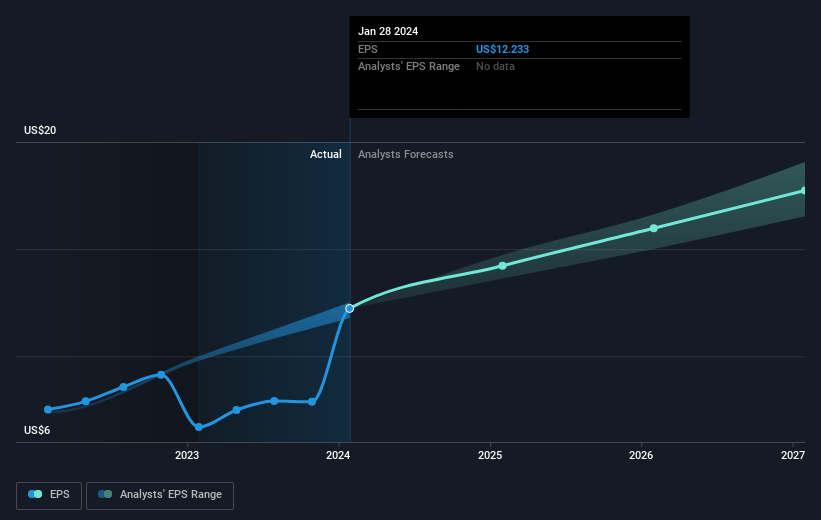
During five years of share price growth, Lululemon Athletica achieved compound earnings per share (EPS) growth of 28% per year. This EPS growth is higher than the 15% average annual increase in the share price. So it seems the market isn't so enthusiastic about the stock these days.
在五年的股價增長中,Lululemon Athletica實現了每年28%的複合每股收益(EPS)增長。每股收益的增長高於股價平均年增長15%。因此,如今市場似乎對該股並不那麼熱情。
You can see below how EPS has changed over time (discover the exact values by clicking on the image).
你可以在下面看到 EPS 是如何隨着時間的推移而變化的(點擊圖片發現確切的值)。
It's probably worth noting we've seen significant insider buying in the last quarter, which we consider a positive. That said, we think earnings and revenue growth trends are even more important factors to consider. This free interactive report on Lululemon Athletica's earnings, revenue and cash flow is a great place to start, if you want to investigate the stock further.
可能值得注意的是,我們在上個季度看到了大量的內幕買盤,我們認爲這是積極的。話雖如此,我們認爲收益和收入增長趨勢是更重要的考慮因素。如果你想進一步調查該股,這份關於Lululemon Athletica收益、收入和現金流的免費互動報告是一個不錯的起點。
A Different Perspective
不同的視角
While the broader market gained around 27% in the last year, Lululemon Athletica shareholders lost 8.9%. However, keep in mind that even the best stocks will sometimes underperform the market over a twelve month period. Longer term investors wouldn't be so upset, since they would have made 15%, each year, over five years. If the fundamental data continues to indicate long term sustainable growth, the current sell-off could be an opportunity worth considering. It is all well and good that insiders have been buying shares, but we suggest you check here to see what price insiders were buying at.
去年整體市場上漲了約27%,而Lululemon Athletica的股東卻下跌了8.9%。但是,請記住,即使是最好的股票有時也會在十二個月內表現不如市場。長期投資者不會那麼沮喪,因爲他們本可以在五年內每年賺15%。如果基本面數據繼續顯示長期可持續增長,那麼當前的拋售可能是一個值得考慮的機會。內部人士買入股票是一件好事,但我們建議你在這裏查看內部人士的買入價格。
If you like to buy stocks alongside management, then you might just love this free list of companies. (Hint: insiders have been buying them).
如果你想與管理層一起購買股票,那麼你可能會喜歡這份免費的公司名單。(提示:業內人士一直在購買它們)。
Please note, the market returns quoted in this article reflect the market weighted average returns of stocks that currently trade on American exchanges.
請注意,本文引用的市場回報反映了目前在美國交易所交易的股票的市場加權平均回報。
Have feedback on this article? Concerned about the content? Get in touch with us directly. Alternatively, email editorial-team (at) simplywallst.com.
This article by Simply Wall St is general in nature. We provide commentary based on historical data and analyst forecasts only using an unbiased methodology and our articles are not intended to be financial advice. It does not constitute a recommendation to buy or sell any stock, and does not take account of your objectives, or your financial situation. We aim to bring you long-term focused analysis driven by fundamental data. Note that our analysis may not factor in the latest price-sensitive company announcements or qualitative material. Simply Wall St has no position in any stocks mentioned.
對這篇文章有反饋嗎?對內容感到擔憂?直接聯繫我們。 或者,給編輯團隊 (at) simplywallst.com 發送電子郵件。
Simply Wall St的這篇文章本質上是籠統的。我們僅使用公正的方法根據歷史數據和分析師的預測提供評論,我們的文章無意作爲財務建議。它不構成買入或賣出任何股票的建議,也沒有考慮到您的目標或財務狀況。我們的目標是爲您提供由基本數據驅動的長期重點分析。請注意,我們的分析可能不考慮最新的價格敏感型公司公告或定性材料。簡而言之,華爾街沒有持有任何上述股票的頭寸。
譯文內容由第三人軟體翻譯。