
Those Who Invested in Altria Group (NYSE:MO) Five Years Ago Are up 26%
Those Who Invested in Altria Group (NYSE:MO) Five Years Ago Are up 26%
The main aim of stock picking is to find the market-beating stocks. But in any portfolio, there will be mixed results between individual stocks. So we wouldn't blame long term Altria Group, Inc. (NYSE:MO) shareholders for doubting their decision to hold, with the stock down 15% over a half decade.
選股的主要目的是尋找市場領先的股票。但是在任何投資組合中,個股之間的結果都會好壞參半。因此,我們不會責怪奧馳亞集團公司(紐約證券交易所代碼:MO)的長期股東懷疑他們的持股決定,該股在五年內下跌了15%。
With that in mind, it's worth seeing if the company's underlying fundamentals have been the driver of long term performance, or if there are some discrepancies.
考慮到這一點,值得一看公司的基本面是否是長期業績的驅動力,或者是否存在一些差異。
While markets are a powerful pricing mechanism, share prices reflect investor sentiment, not just underlying business performance. One flawed but reasonable way to assess how sentiment around a company has changed is to compare the earnings per share (EPS) with the share price.
雖然市場是一種強大的定價機制,但股價反映了投資者的情緒,而不僅僅是潛在的業務表現。評估公司情緒變化的一種有缺陷但合理的方法是將每股收益(EPS)與股價進行比較。
During the unfortunate half decade during which the share price slipped, Altria Group actually saw its earnings per share (EPS) improve by 8.4% per year. So it doesn't seem like EPS is a great guide to understanding how the market is valuing the stock. Alternatively, growth expectations may have been unreasonable in the past.
在股價下滑的不幸五年中,奧馳亞集團的每股收益(EPS)實際上每年增長8.4%。因此,每股收益似乎不是了解市場如何估值股票的好指南。或者,過去的增長預期可能不合理。
It is unusual to see such modest share price growth in the face of sustained EPS improvements. We can look to other metrics to try to understand the situation better.
面對每股收益的持續改善,股價如此溫和的增長是不尋常的。我們可以參考其他指標來嘗試更好地了解情況。
We note that the dividend has remained healthy, so that wouldn't really explain the share price drop. While it's not completely obvious why the share price is down, a closer look at the company's history might help explain it.
我們注意到股息一直保持健康,因此這並不能真正解釋股價下跌的原因。儘管股價下跌的原因尚不完全明顯,但仔細研究該公司的歷史可能有助於解釋這一點。
The image below shows how earnings and revenue have tracked over time (if you click on the image you can see greater detail).
下圖顯示了收入和收入隨時間推移的跟蹤情況(如果您點擊圖片,可以看到更多細節)。
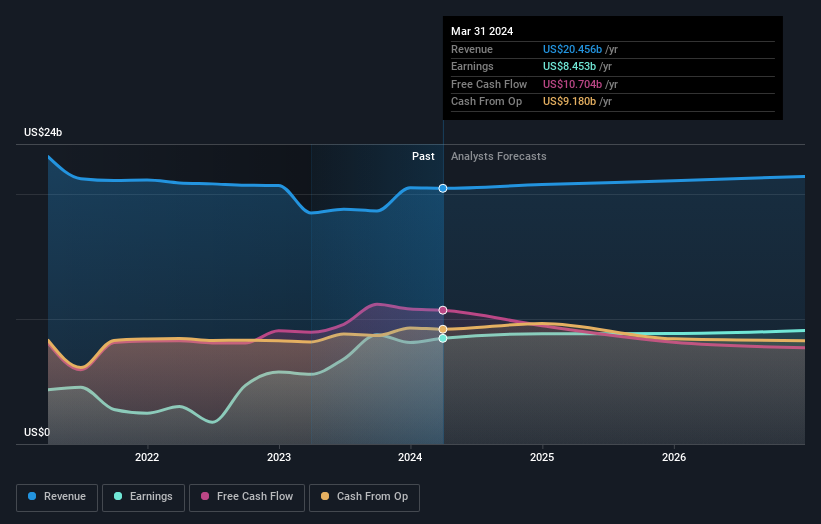
Altria Group is a well known stock, with plenty of analyst coverage, suggesting some visibility into future growth. You can see what analysts are predicting for Altria Group in this interactive graph of future profit estimates.
奧馳亞集團是一隻知名股票,有大量分析師報道,這表明未來增長有一定的可見性。您可以在這張未來利潤估計的交互式圖表中看到分析師對奧馳亞集團的預測。
What About Dividends?
分紅呢?
When looking at investment returns, it is important to consider the difference between total shareholder return (TSR) and share price return. The TSR incorporates the value of any spin-offs or discounted capital raisings, along with any dividends, based on the assumption that the dividends are reinvested. So for companies that pay a generous dividend, the TSR is often a lot higher than the share price return. We note that for Altria Group the TSR over the last 5 years was 26%, which is better than the share price return mentioned above. And there's no prize for guessing that the dividend payments largely explain the divergence!
在考慮投資回報時,重要的是要考慮兩者之間的區別 股東總回報 (TSR) 和 股價回報。基於股息再投資的假設,股東總回報率納入了任何分拆或貼現資本籌集的價值以及任何股息。因此,對於支付豐厚股息的公司來說,股東總回報率通常遠高於股價回報率。我們注意到,奧馳亞集團過去5年的股東總回報率爲26%,好於上述股價回報率。而且,猜測股息支付在很大程度上解釋了這種分歧是沒有好處的!
A Different Perspective
不同的視角
Altria Group provided a TSR of 3.1% over the last twelve months. Unfortunately this falls short of the market return. If we look back over five years, the returns are even better, coming in at 5% per year for five years. Maybe the share price is just taking a breather while the business executes on its growth strategy. It's always interesting to track share price performance over the longer term. But to understand Altria Group better, we need to consider many other factors. To that end, you should be aware of the 1 warning sign we've spotted with Altria Group .
在過去的十二個月中,奧馳亞集團的股東回報率爲3.1%。不幸的是,這沒有達到市場回報率。如果我們回顧五年,回報率甚至更高,五年內每年爲5%。也許在企業執行增長戰略的同時,股價只是在稍作休息。長期跟蹤股價表現總是很有意思的。但是,爲了更好地了解奧馳亞集團,我們需要考慮許多其他因素。爲此,你應該注意我們在奧馳亞集團發現的1個警告信號。
Of course Altria Group may not be the best stock to buy. So you may wish to see this free collection of growth stocks.
當然,奧馳亞集團可能不是最值得購買的股票。因此,您可能希望看到這批免費的成長股。
Please note, the market returns quoted in this article reflect the market weighted average returns of stocks that currently trade on American exchanges.
請注意,本文引用的市場回報反映了目前在美國交易所交易的股票的市場加權平均回報。
Have feedback on this article? Concerned about the content? Get in touch with us directly. Alternatively, email editorial-team (at) simplywallst.com.
This article by Simply Wall St is general in nature. We provide commentary based on historical data and analyst forecasts only using an unbiased methodology and our articles are not intended to be financial advice. It does not constitute a recommendation to buy or sell any stock, and does not take account of your objectives, or your financial situation. We aim to bring you long-term focused analysis driven by fundamental data. Note that our analysis may not factor in the latest price-sensitive company announcements or qualitative material. Simply Wall St has no position in any stocks mentioned.
對這篇文章有反饋嗎?對內容感到擔憂?直接聯繫我們。 或者,給編輯團隊 (at) simplywallst.com 發送電子郵件。
Simply Wall St的這篇文章本質上是籠統的。我們僅使用公正的方法根據歷史數據和分析師的預測提供評論,我們的文章無意作爲財務建議。它不構成買入或賣出任何股票的建議,也沒有考慮到您的目標或財務狀況。我們的目標是爲您提供由基本數據驅動的長期重點分析。請注意,我們的分析可能不考慮最新的價格敏感型公司公告或定性材料。簡而言之,華爾街沒有持有任何上述股票的頭寸。
譯文內容由第三人軟體翻譯。