
CyberArk Software (NASDAQ:CYBR) Shareholders Have Earned a 25% CAGR Over the Last Three Years
CyberArk Software (NASDAQ:CYBR) Shareholders Have Earned a 25% CAGR Over the Last Three Years
One simple way to benefit from the stock market is to buy an index fund. But many of us dare to dream of bigger returns, and build a portfolio ourselves. For example, CyberArk Software Ltd. (NASDAQ:CYBR) shareholders have seen the share price rise 95% over three years, well in excess of the market return (14%, not including dividends). However, more recent returns haven't been as impressive as that, with the stock returning just 74% in the last year.
從股票市場中獲益的一種簡單方法是購買指數基金。但是我們中的許多人敢於夢想獲得更大的回報,並自己建立投資組合。例如,CyberArk軟件有限公司(納斯達克股票代碼:CYBR)股東的股價在三年內上漲了95%,遠遠超過了市場回報率(14%,不包括股息)。但是,最近的回報並不那麼令人印象深刻,該股去年的回報率僅爲74%。
With that in mind, it's worth seeing if the company's underlying fundamentals have been the driver of long term performance, or if there are some discrepancies.
考慮到這一點,值得一看公司的基本面是否是長期業績的驅動力,或者是否存在一些差異。
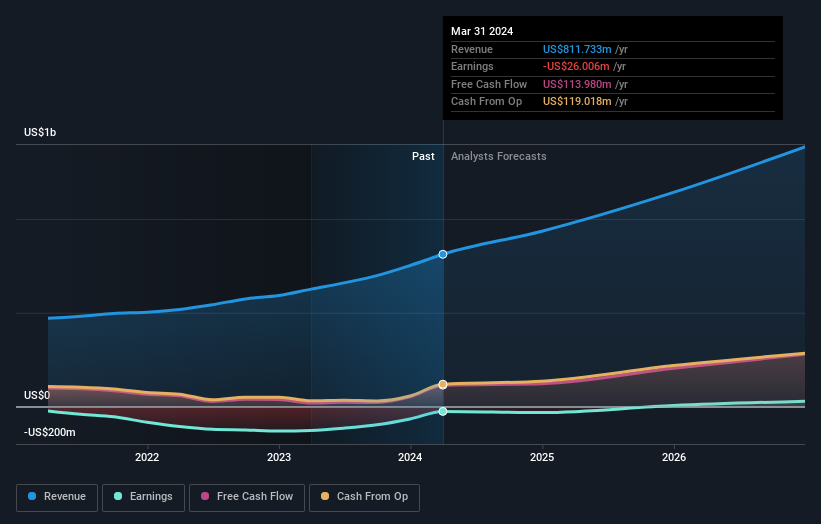
Because CyberArk Software made a loss in the last twelve months, we think the market is probably more focussed on revenue and revenue growth, at least for now. Generally speaking, companies without profits are expected to grow revenue every year, and at a good clip. As you can imagine, fast revenue growth, when maintained, often leads to fast profit growth.
由於CyberArk Software在過去十二個月中出現了虧損,因此我們認爲至少目前市場可能更加關注收入和收入增長。一般而言,沒有利潤的公司預計每年收入將增長,而且速度很快。可以想象,收入的快速增長如果持續下去,通常會帶來利潤的快速增長。
Over the last three years CyberArk Software has grown its revenue at 18% annually. That's a very respectable growth rate. The share price gain of 25% per year shows that the market is paying attention to this growth. Of course, valuation is quite sensitive to the rate of growth. Keep in mind that the strength of the balance sheet impacts the options open to the company.
在過去的三年中,CyberArk Software的收入每年增長18%。這是一個非常可觀的增長率。每年25%的股價上漲表明市場正在關注這種增長。當然,估值對增長率非常敏感。請記住,資產負債表的強度會影響公司可以選擇的期權。
The image below shows how earnings and revenue have tracked over time (if you click on the image you can see greater detail).
下圖顯示了收入和收入隨時間推移的跟蹤情況(如果您點擊圖片,可以看到更多細節)。
We're pleased to report that the CEO is remunerated more modestly than most CEOs at similarly capitalized companies. It's always worth keeping an eye on CEO pay, but a more important question is whether the company will grow earnings throughout the years. If you are thinking of buying or selling CyberArk Software stock, you should check out this free report showing analyst profit forecasts.
我們很高興地向大家報告,首席執行官的薪酬比資本相似公司的大多數首席執行官要適中。始終值得關注首席執行官的薪酬,但更重要的問題是公司多年來是否會增加收益。如果您正在考慮買入或賣出CyberArk Software股票,則應查看這份顯示分析師利潤預測的免費報告。
A Different Perspective
不同的視角
We're pleased to report that CyberArk Software shareholders have received a total shareholder return of 74% over one year. That's better than the annualised return of 14% over half a decade, implying that the company is doing better recently. Someone with an optimistic perspective could view the recent improvement in TSR as indicating that the business itself is getting better with time. It's always interesting to track share price performance over the longer term. But to understand CyberArk Software better, we need to consider many other factors. To that end, you should be aware of the 1 warning sign we've spotted with CyberArk Software .
我們很高興地向大家報告,CyberArk Software的股東在一年內獲得了74%的總股東回報率。這比五年來14%的年化回報率要好,這意味着該公司最近的表現更好。持樂觀態度的人可能會將最近股東總回報率的改善視爲業務本身隨着時間的推移而變得更好。長期跟蹤股價表現總是很有意思的。但是,爲了更好地理解 CyberArk 軟件,我們需要考慮許多其他因素。爲此,你應該注意我們在CyberArk軟件中發現的1個警告信號。
But note: CyberArk Software may not be the best stock to buy. So take a peek at this free list of interesting companies with past earnings growth (and further growth forecast).
但請注意:CyberArk軟件可能不是最值得購買的股票。因此,來看看這份過去盈利增長(以及進一步增長預測)的有趣公司的免費清單。
Please note, the market returns quoted in this article reflect the market weighted average returns of stocks that currently trade on American exchanges.
請注意,本文引用的市場回報反映了目前在美國交易所交易的股票的市場加權平均回報。
Have feedback on this article? Concerned about the content? Get in touch with us directly. Alternatively, email editorial-team (at) simplywallst.com.
This article by Simply Wall St is general in nature. We provide commentary based on historical data and analyst forecasts only using an unbiased methodology and our articles are not intended to be financial advice. It does not constitute a recommendation to buy or sell any stock, and does not take account of your objectives, or your financial situation. We aim to bring you long-term focused analysis driven by fundamental data. Note that our analysis may not factor in the latest price-sensitive company announcements or qualitative material. Simply Wall St has no position in any stocks mentioned.
對這篇文章有反饋嗎?對內容感到擔憂?直接聯繫我們。 或者,給編輯團隊 (at) simplywallst.com 發送電子郵件。
Simply Wall St的這篇文章本質上是籠統的。我們僅使用公正的方法根據歷史數據和分析師的預測提供評論,我們的文章無意作爲財務建議。它不構成買入或賣出任何股票的建議,也沒有考慮到您的目標或財務狀況。我們的目標是爲您提供由基本數據驅動的長期重點分析。請注意,我們的分析可能不考慮最新的價格敏感型公司公告或定性材料。簡而言之,華爾街沒有持有任何上述股票的頭寸。
譯文內容由第三人軟體翻譯。