
 Yahoo Finance
 Fidelity National's (FIS) Shares Up 5.5% Since Q1 Earnings Beat
Fidelity National Information Services, Inc. FIS shares gained 5.5% since it reported first-quarter 2024 results on May 6, 2024. Upward revision in adjusted earnings per share (EPS) guidance, along with favorable EBITDA margin expansion, might have buoyed investor confidence in the stock. The first-quarter earnings benefited from strong recurring revenue growth in both the segments and strong new sales growth. However, negative professional services revenue growth in both segments and a less favorable revenue mix in Capital Markets partially offset the results.
FIS reported first-quarter 2024 adjusted EPS of $1.10, which beat the Zacks Consensus Estimate by 14.6%. However, the bottom line declined 14.7% year over year.
Revenues dipped 29.6% year over year to $2.5 billion. However, the top line beat the consensus mark of $2.4 billion.
Fidelity National Information Services, Inc. Price, Consensus and EPS Surprise
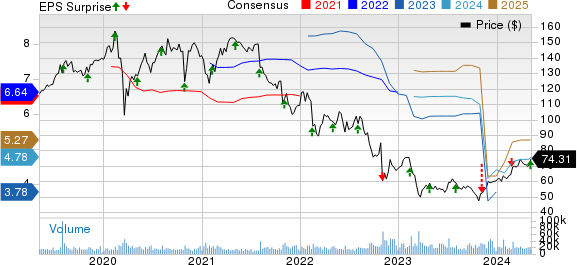
Fidelity National Information Services, Inc. price-consensus-eps-surprise-chart | Fidelity National Information Services, Inc. Quote
Q1 Performance
The cost of revenues was $1.55 billion in the quarter under review, which slipped 1.2% year over year. Selling, general and administrative expenses of Fidelity National increased 10.8% year over year to $573 million and were higher than our estimate of $524.9 million. Net interest expenses declined 45.8% year over year to $77 million and was lower than our estimate of $95 million.
Adjusted earnings before interest, tax, depreciation and amortization (EBITDA) rose 8% year over year to $975 million and beat our estimate of $966.2 million. Adjusted EBITDA margin of 39.5% improved 200 basis points (bps) year over year in the first quarter.
Segmental Update
Revenues from the Banking Solutions unit increased 2% year over year to $1.68 billion, higher than the Zacks Consensus Estimate and our estimate of $1.67 billion. Improved adjusted recurring revenues and adjusted non-recurring revenues shaped the segment’s quarterly performance. Adjusted EBITDA was $745 million in the quarter under review, which surpassed the consensus mark of $697 million and our estimate of $726.3 million. Adjusted EBITDA margin of 44.3% improved 350 bps year over year, attributable to cost efficiencies.
The Capital Market Solutions segment recorded revenues of $706 million, which grew 7% year over year in the first quarter and beat the Zacks Consensus Estimate of $705 million. The metric improved as a result of strong recurring revenue growth. Adjusted EBITDA of $335 million missed the consensus mark of $342 million. Adjusted EBITDA margin deteriorated 80 bps year over year to 47.4% due to a less favorable revenue mix.
The Corporate and Other segment’s revenues amounted to $77 million, which declined 12% year over year in the quarter under review. The reported figure surpassed the Zacks Consensus Estimate of $66 million and our estimate of $70.3 million. Adjusted EBITDA loss was $105 million in the quarter under review, wider than the Zacks Consensus Estimate of a loss of $76 million. This segment’s results suffered due to lower recurring revenues and higher operating expenses.
Financial Update (As of Mar 31, 2024)
Fidelity National exited the first quarter with cash and cash equivalents of $3.3 billion, up from $440 million at 2023-end. Total assets of $35.9 billion fell from $55.1 billion at 2023-end.
Long-term debt, excluding current portion, amounted to $10.6 billion, down from $13 billion at 2023-end. The current portion of long-term debt totaled $587 million. There were no short-term borrowings at 2023-end.
Total equity of $18 billion dropped from $19.1 billion at 2023-end.
FIS generated net cash from operations of $206 million in the first quarter, which declined 29.2% year over year. Free cash flows declined 44.8% year over year to $95 million.
Share Repurchase & Dividend Update
Fidelity National rewarded $1.6 billion to its shareholders to the tune of share buybacks worth $1.4 billion and dividends of $209 million in the first quarter.
Capital Deployment Targets
Management aims to return a minimum of roughly $4 billion to its shareholders through share buybacks by the end of 2024, which includes $1.4 billion in repurchases conducted in the first quarter of 2024. FIS reiterates its aim to achieve a dividend payout ratio of 35% of adjusted net earnings, excluding equity method investment earnings (loss).
Update on Enterprise Transformation Program
FIS earlier reiterated its aim to achieve cash savings of $1 billion by 2024-end, out of which more than 75% belong to run-rate cash savings. It is also likely to benefit the company by bringing about a year-over-year increase of $280 million in adjusted EBITDA in 2024.
2Q24 View
Management forecasts revenues between $2.465 billion and $2.490 billion. Adjusted EBITDA is projected to be in the range of $980-$995 million. Adjusted EPS is estimated to be between $1.21 and $1.25. Adjusted EBITDA margin is projected to be in the range of 39.8-40%.
Revenues from the Banking Solutions unit are anticipated to witness a year-over-year increase of 2-2.5%, while it is estimated to grow in the range of 7-8% for the Capital Market Solutions business.
2024 Guidance
Revenues are expected to lie within $10.10-$10.15 billion, the mid-point of which indicates an improvement of 3.1% from the 2023 figure of $9.8 billion.
The Banking Solutions and Capital Market Solutions units are estimated to record year-over-year increases of 3-3.5% and 6.5-7%, respectively.
Adjusted EBITDA is projected between $4.10 billion and $4.14 billion in 2024, the midpoint of which suggests 3.7% growth from the 2023 figure of $4 billion. Adjusted EBITDA margin is anticipated within 40.6-40.8%.
Adjusted EPS guidance is revised upward between $4.88 and $4.98, the mid-point of which implies a 46.3% surge from the 2023 figure of $3.37. EPS is expected to benefit from lower effective tax rate, interest expenses and shares outstanding. 45% ownership in Worldpay is expected to generate income of $400-$415 million in 2024, benefiting the metric.
Net interest expenses are likely to stay within $320-$325 million for 2024.
Zacks Rank
Fidelity National currently carries a Zacks Rank #2 (Buy). You can see the complete list of today’s Zacks #1 Rank (Strong Buy) stocks here.
Other Business Services Sector Releases
Of the Business Services sector players that have already released first-quarter 2024 results so far, the bottom-line results of Mastercard Incorporated MA, Global Payments Inc. GPN and The Western Union Company WU beat the Zacks Consensus Estimate.
Mastercard reported first-quarter 2024 adjusted earnings of $3.31 per share, which outpaced the Zacks Consensus Estimate by 2.8%. The bottom line climbed 18% year over year. Net revenues of the leading technology company in the global payments industry amounted to $6.3 billion, which improved 10% year over year in the quarter under review. The top line beat the consensus mark by 0.4%. Gross dollar volume rose 10% on a local-currency basis to $2.3 trillion in the first quarter.
Cross-border volumes (a key measure that tracks spending on cards beyond the issuing country) advanced 18% on a local currency basis. Value-added services and solutions net revenues of $2.4 billion improved 16% year over year. Mastercard’s clients issued 3.4 billion Mastercard and Maestro-branded cards as of Mar 31, 2024. Its operating income advanced 15% year over year to $3.6 billion. Operating margin of 56.8% improved 220 bps year over year in the quarter under review.
Global Payments reported first-quarter 2024 adjusted earnings of $2.59 per share, which beat the Zacks Consensus Estimate by 7.5%. The bottom line rose 21.6% year over year. Adjusted net revenues improved 6.6% year over year to $2.18 billion. The top line surpassed the consensus mark of $2.17 billion. Adjusted operating income of $949.6 million advanced 7.6% year over year in the quarter under review.
The adjusted operating margin improved 40 bps year over year to 43.5%. The Merchant Solutions segment recorded adjusted revenues of $1.68 billion in the first quarter, which rose 15.6% year over year. The unit’s adjusted operating income advanced 14.8% year over year to $790.4 million. Meanwhile, GPN’s Issuer Solutions segment reported adjusted revenues of $515.6 million, which grew 5.2% year over year in the quarter under review.
Western Union reported first-quarter 2024 adjusted earnings of 45 cents per share, which beat the Zacks Consensus Estimate by 12.5%. The bottom line rose nearly 5% year over year. Total revenues increased more than 1% year over year on a reported basis, or 3% on an adjusted basis, to nearly $1.05 billion. The top line beat the Zacks Consensus Estimate by 3.9%.
Adjusted operating margin of 19.7% deteriorated 80 bps year over year due to the timing of marketing expenses and increased redeployment costs. The CMT or Consumer Money Transfer segment reported revenues of $962 million, which increased 3% year over year in the quarter under review. Operating income improved 6% year over year to $187.6 million. The operating income margin was 19.5%. Transactions within the CMT segment increased 6% year over year. Branded Digital revenues increased 9% on a reported and adjusted basis.
Want the latest recommendations from Zacks Investment Research? Today, you can download 7 Best Stocks for the Next 30 Days. Click to get this free report
Mastercard Incorporated (MA) : Free Stock Analysis Report
Fidelity National Information Services, Inc. (FIS) : Free Stock Analysis Report
The Western Union Company (WU) : Free Stock Analysis Report
Global Payments Inc. (GPN) : Free Stock Analysis Report
