
Cavco Industries (NASDAQ:CVCO) Shareholders Have Earned a 26% CAGR Over the Last Five Years
Cavco Industries (NASDAQ:CVCO) Shareholders Have Earned a 26% CAGR Over the Last Five Years
When you buy a stock there is always a possibility that it could drop 100%. But when you pick a company that is really flourishing, you can make more than 100%. For instance, the price of Cavco Industries, Inc. (NASDAQ:CVCO) stock is up an impressive 224% over the last five years. In the last week the share price is up 1.9%.
當你買入股票時,它總是有可能下跌100%。但是,當你選擇一家真正蓬勃發展的公司時,你可以 使 超過 100%。例如,Cavco Industries, Inc.(納斯達克股票代碼:CVCO)的股票價格在過去五年中上漲了令人印象深刻的224%。上週,股價上漲了1.9%。
So let's investigate and see if the longer term performance of the company has been in line with the underlying business' progress.
因此,讓我們調查一下,看看公司的長期表現是否與基礎業務的進展一致。
While the efficient markets hypothesis continues to be taught by some, it has been proven that markets are over-reactive dynamic systems, and investors are not always rational. One flawed but reasonable way to assess how sentiment around a company has changed is to compare the earnings per share (EPS) with the share price.
儘管一些人繼續教導高效市場假說,但事實證明,市場是反應過度的動態系統,投資者並不總是理性的。評估公司情緒變化的一種有缺陷但合理的方法是將每股收益(EPS)與股價進行比較。
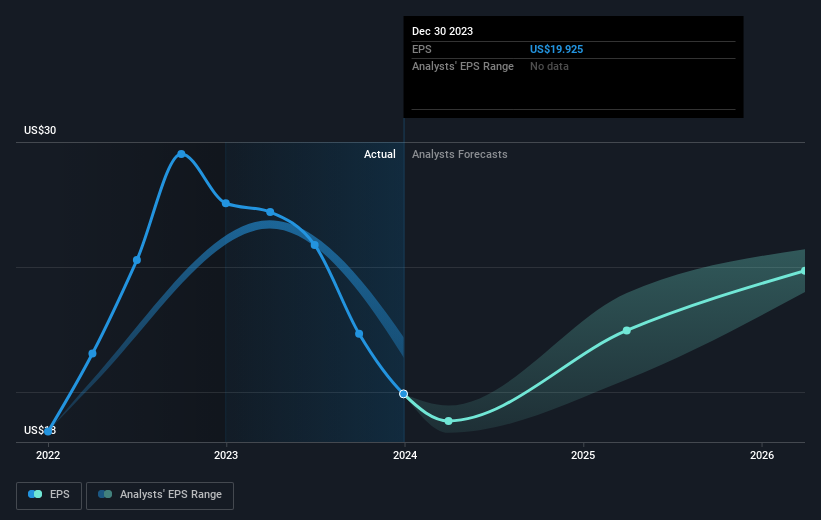
Over half a decade, Cavco Industries managed to grow its earnings per share at 21% a year. This EPS growth is reasonably close to the 26% average annual increase in the share price. That suggests that the market sentiment around the company hasn't changed much over that time. In fact, the share price seems to largely reflect the EPS growth.
在過去的五年中,Cavco Industries設法將其每股收益增長到每年21%。每股收益的增長相當接近股價年均增長26%。這表明,在那段時間內,公司周圍的市場情緒沒有太大變化。實際上,股價似乎在很大程度上反映了每股收益的增長。
You can see how EPS has changed over time in the image below (click on the chart to see the exact values).
您可以在下圖中看到 EPS 隨時間推移的變化(點擊圖表查看確切值)。
We know that Cavco Industries has improved its bottom line over the last three years, but what does the future have in store? You can see how its balance sheet has strengthened (or weakened) over time in this free interactive graphic.
我們知道Cavco Industries在過去三年中提高了利潤,但是未來會怎樣?您可以在這張免費的交互式圖片中看到其資產負債表如何隨着時間的推移而增強(或減弱)。
A Different Perspective
不同的視角
Cavco Industries shareholders have received returns of 25% over twelve months, which isn't far from the general market return. It has to be noted that the recent return falls short of the 26% shareholders have gained each year, over half a decade. More recently, the share price growth has slowed. But it has to be said the overall picture is one of good long term and short term performance. Arguably that makes Cavco Industries a stock worth watching. Most investors take the time to check the data on insider transactions. You can click here to see if insiders have been buying or selling.
Cavco Industries的股東在十二個月內獲得了25%的回報,這與總體市場回報率相差不遠。必須指出的是,最近的回報率低於五年來股東每年獲得的26%。最近,股價增長放緩。但必須說,總體情況是長期和短期表現良好。可以說,這使Cavco Industries成爲值得關注的股票。大多數投資者花時間檢查內幕交易數據。您可以點擊此處查看內部人士是否在買入或賣出。
We will like Cavco Industries better if we see some big insider buys. While we wait, check out this free list of growing companies with considerable, recent, insider buying.
如果我們看到一些重大的內幕收購,我們會更喜歡Cavco Industries。在我們等待的同時,請查看這份免費清單,列出了最近有大量內幕收購的成長型公司。
Please note, the market returns quoted in this article reflect the market weighted average returns of stocks that currently trade on American exchanges.
請注意,本文引用的市場回報反映了目前在美國交易所交易的股票的市場加權平均回報。
Have feedback on this article? Concerned about the content? Get in touch with us directly. Alternatively, email editorial-team (at) simplywallst.com.
This article by Simply Wall St is general in nature. We provide commentary based on historical data and analyst forecasts only using an unbiased methodology and our articles are not intended to be financial advice. It does not constitute a recommendation to buy or sell any stock, and does not take account of your objectives, or your financial situation. We aim to bring you long-term focused analysis driven by fundamental data. Note that our analysis may not factor in the latest price-sensitive company announcements or qualitative material. Simply Wall St has no position in any stocks mentioned.
對這篇文章有反饋嗎?對內容感到擔憂?直接聯繫我們。 或者,給編輯團隊 (at) simplywallst.com 發送電子郵件。
Simply Wall St的這篇文章本質上是籠統的。我們僅使用公正的方法根據歷史數據和分析師的預測提供評論,我們的文章無意作爲財務建議。它不構成買入或賣出任何股票的建議,也沒有考慮到您的目標或財務狀況。我們的目標是爲您提供由基本數據驅動的長期重點分析。請注意,我們的分析可能不考慮最新的價格敏感型公司公告或定性材料。簡而言之,華爾街沒有持有任何上述股票的頭寸。
譯文內容由第三人軟體翻譯。