
 Yahoo Finance
 Tex Cycle Technology (M) Berhad (KLSE:TEXCYCL) Is Looking To Continue Growing Its Returns On Capital
If we want to find a potential multi-bagger, often there are underlying trends that can provide clues. In a perfect world, we'd like to see a company investing more capital into its business and ideally the returns earned from that capital are also increasing. If you see this, it typically means it's a company with a great business model and plenty of profitable reinvestment opportunities. So when we looked at Tex Cycle Technology (M) Berhad (KLSE:TEXCYCL) and its trend of ROCE, we really liked what we saw.
Return On Capital Employed (ROCE): What Is It?
For those who don't know, ROCE is a measure of a company's yearly pre-tax profit (its return), relative to the capital employed in the business. The formula for this calculation on Tex Cycle Technology (M) Berhad is:
Return on Capital Employed = Earnings Before Interest and Tax (EBIT) ÷ (Total Assets - Current Liabilities)
0.12 = RM20m ÷ (RM179m - RM8.0m) (Based on the trailing twelve months to December 2023).
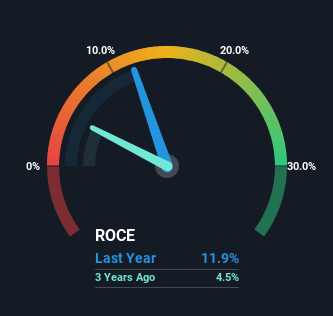
Thus, Tex Cycle Technology (M) Berhad has an ROCE of 12%. In absolute terms, that's a satisfactory return, but compared to the Commercial Services industry average of 9.1% it's much better.
Check out our latest analysis for Tex Cycle Technology (M) Berhad
While the past is not representative of the future, it can be helpful to know how a company has performed historically, which is why we have this chart above. If you'd like to look at how Tex Cycle Technology (M) Berhad has performed in the past in other metrics, you can view this free graph of Tex Cycle Technology (M) Berhad's past earnings, revenue and cash flow.
How Are Returns Trending?
Investors would be pleased with what's happening at Tex Cycle Technology (M) Berhad. Over the last five years, returns on capital employed have risen substantially to 12%. The amount of capital employed has increased too, by 48%. The increasing returns on a growing amount of capital is common amongst multi-baggers and that's why we're impressed.
The Bottom Line On Tex Cycle Technology (M) Berhad's ROCE
All in all, it's terrific to see that Tex Cycle Technology (M) Berhad is reaping the rewards from prior investments and is growing its capital base. Since the stock has returned a staggering 156% to shareholders over the last five years, it looks like investors are recognizing these changes. In light of that, we think it's worth looking further into this stock because if Tex Cycle Technology (M) Berhad can keep these trends up, it could have a bright future ahead.
On a final note, we've found 2 warning signs for Tex Cycle Technology (M) Berhad that we think you should be aware of.
For those who like to invest in solid companies, check out this free list of companies with solid balance sheets and high returns on equity.
Have feedback on this article? Concerned about the content? Get in touch with us directly. Alternatively, email editorial-team (at) simplywallst.com.
This article by Simply Wall St is general in nature. We provide commentary based on historical data and analyst forecasts only using an unbiased methodology and our articles are not intended to be financial advice. It does not constitute a recommendation to buy or sell any stock, and does not take account of your objectives, or your financial situation. We aim to bring you long-term focused analysis driven by fundamental data. Note that our analysis may not factor in the latest price-sensitive company announcements or qualitative material. Simply Wall St has no position in any stocks mentioned.
