
Recent 3.3% Pullback Isn't Enough to Hurt Long-term Catalyst Pharmaceuticals (NASDAQ:CPRX) Shareholders, They're Still up 366% Over 5 Years
Recent 3.3% Pullback Isn't Enough to Hurt Long-term Catalyst Pharmaceuticals (NASDAQ:CPRX) Shareholders, They're Still up 366% Over 5 Years
We think all investors should try to buy and hold high quality multi-year winners. While not every stock performs well, when investors win, they can win big. Just think about the savvy investors who held Catalyst Pharmaceuticals, Inc. (NASDAQ:CPRX) shares for the last five years, while they gained 366%. If that doesn't get you thinking about long term investing, we don't know what will. But it's down 3.3% in the last week.
我們認爲,所有投資者都應該嘗試買入並持有高質量的多年期贏家。儘管並非每隻股票都表現良好,但當投資者獲勝時,他們可以大獲全勝。想想那些在過去五年中持有Catalyst Pharmicals, Inc.(納斯達克股票代碼:CPRX)股票的精明投資者,他們上漲了366%。如果這不能讓你考慮長期投資,我們不知道會怎樣。但上週下跌了3.3%。
Although Catalyst Pharmaceuticals has shed US$60m from its market cap this week, let's take a look at its longer term fundamental trends and see if they've driven returns.
儘管Catalyst Pharmicals本週的市值已經下跌了6000萬美元,但讓我們來看看其長期基本面趨勢,看看它們是否推動了回報。
While the efficient markets hypothesis continues to be taught by some, it has been proven that markets are over-reactive dynamic systems, and investors are not always rational. One way to examine how market sentiment has changed over time is to look at the interaction between a company's share price and its earnings per share (EPS).
儘管一些人繼續教導高效市場假說,但事實證明,市場是反應過度的動態系統,投資者並不總是理性的。研究市場情緒如何隨着時間的推移而變化的一種方法是研究公司股價與其每股收益(EPS)之間的相互作用。
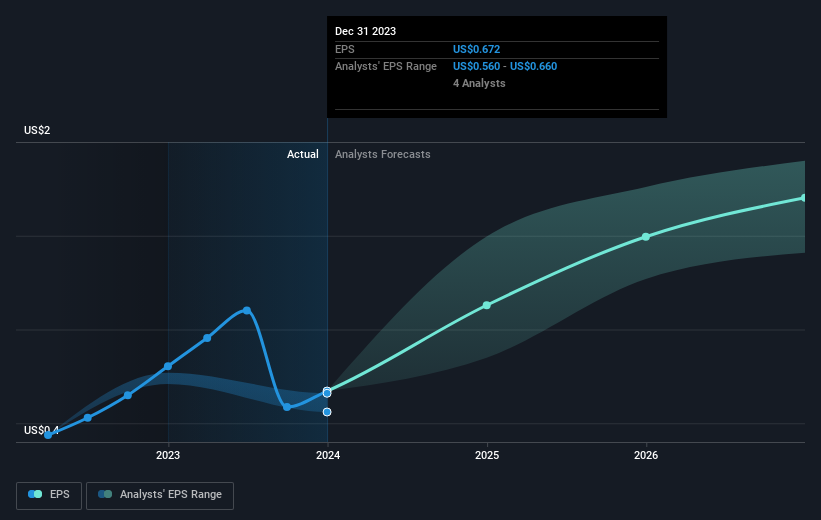
During the last half decade, Catalyst Pharmaceuticals became profitable. Sometimes, the start of profitability is a major inflection point that can signal fast earnings growth to come, which in turn justifies very strong share price gains.
在過去的五年中,催化劑製藥實現了盈利。有時,盈利能力的開始是一個重要的轉折點,這可能預示着收益的快速增長,這反過來又證明了股價的強勁上漲是合理的。
You can see how EPS has changed over time in the image below (click on the chart to see the exact values).
您可以在下圖中看到 EPS 隨時間推移的變化(點擊圖表查看確切值)。
This free interactive report on Catalyst Pharmaceuticals' earnings, revenue and cash flow is a great place to start, if you want to investigate the stock further.
如果你想進一步調查該股,這份關於Catalyst Pharmaceuticals收益、收入和現金流的免費互動報告是一個很好的起點。
A Different Perspective
不同的視角
While the broader market gained around 26% in the last year, Catalyst Pharmaceuticals shareholders lost 15%. Even the share prices of good stocks drop sometimes, but we want to see improvements in the fundamental metrics of a business, before getting too interested. On the bright side, long term shareholders have made money, with a gain of 36% per year over half a decade. It could be that the recent sell-off is an opportunity, so it may be worth checking the fundamental data for signs of a long term growth trend. I find it very interesting to look at share price over the long term as a proxy for business performance. But to truly gain insight, we need to consider other information, too. Case in point: We've spotted 4 warning signs for Catalyst Pharmaceuticals you should be aware of, and 1 of them is potentially serious.
去年整體市場上漲了約26%,而Catalyst Pharmicals的股東卻下跌了15%。即使是優質股票的股價有時也會下跌,但我們希望在過於感興趣之前看到企業基本指標的改善。好的一面是,長期股東賺了錢,在過去的五年中,每年增長36%。最近的拋售可能是一個機會,因此可能值得查看基本面數據以尋找長期增長趨勢的跡象。我發現將長期股價視爲業務績效的代表非常有趣。但是,要真正獲得見解,我們還需要考慮其他信息。一個很好的例子:我們發現了你應該注意的4種Catalyst Pharmicals警告信號,其中一個可能很嚴重。
If you are like me, then you will not want to miss this free list of growing companies that insiders are buying.
如果你像我一樣,那麼你不會想錯過這份業內人士正在收購的成長型公司的免費名單。
Please note, the market returns quoted in this article reflect the market weighted average returns of stocks that currently trade on American exchanges.
請注意,本文引用的市場回報反映了目前在美國交易所交易的股票的市場加權平均回報。
Have feedback on this article? Concerned about the content? Get in touch with us directly. Alternatively, email editorial-team (at) simplywallst.com.
This article by Simply Wall St is general in nature. We provide commentary based on historical data and analyst forecasts only using an unbiased methodology and our articles are not intended to be financial advice. It does not constitute a recommendation to buy or sell any stock, and does not take account of your objectives, or your financial situation. We aim to bring you long-term focused analysis driven by fundamental data. Note that our analysis may not factor in the latest price-sensitive company announcements or qualitative material. Simply Wall St has no position in any stocks mentioned.
對這篇文章有反饋嗎?對內容感到擔憂?直接聯繫我們。 或者,給編輯團隊 (at) simplywallst.com 發送電子郵件。
Simply Wall St的這篇文章本質上是籠統的。我們僅使用公正的方法根據歷史數據和分析師的預測提供評論,我們的文章無意作爲財務建議。它不構成買入或賣出任何股票的建議,也沒有考慮到您的目標或財務狀況。我們的目標是爲您提供由基本數據驅動的長期重點分析。請注意,我們的分析可能不考慮最新的價格敏感型公司公告或定性材料。簡而言之,華爾街沒有持有任何上述股票的頭寸。
譯文內容由第三人軟體翻譯。