Calculating The Intrinsic Value Of Vertiv Holdings Co (NYSE:VRT)
Key Insights
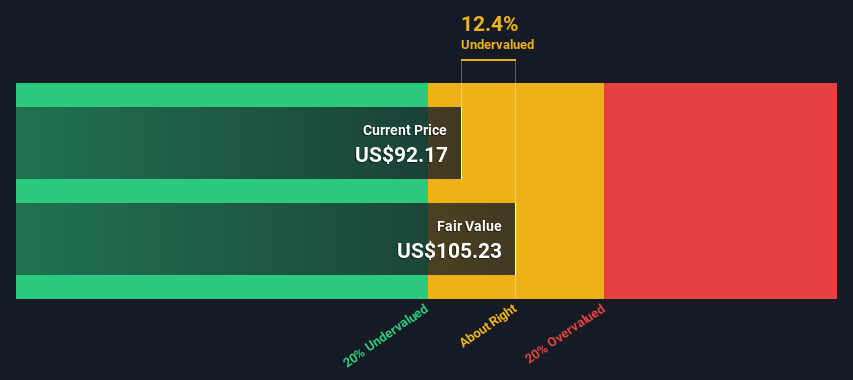
Vertiv Holdings Co's estimated fair value is US$105 based on 2 Stage Free Cash Flow to Equity
Current share price of US$92.17 suggests Vertiv Holdings Co is potentially trading close to its fair value
Our fair value estimate is 7.9% higher than Vertiv Holdings Co's analyst price target of US$97.52
How far off is Vertiv Holdings Co (NYSE:VRT) from its intrinsic value? Using the most recent financial data, we'll take a look at whether the stock is fairly priced by estimating the company's future cash flows and discounting them to their present value. One way to achieve this is by employing the Discounted Cash Flow (DCF) model. Believe it or not, it's not too difficult to follow, as you'll see from our example!
We generally believe that a company's value is the present value of all of the cash it will generate in the future. However, a DCF is just one valuation metric among many, and it is not without flaws. For those who are keen learners of equity analysis, the Simply Wall St analysis model here may be something of interest to you.
View our latest analysis for Vertiv Holdings Co
The Method
We are going to use a two-stage DCF model, which, as the name states, takes into account two stages of growth. The first stage is generally a higher growth period which levels off heading towards the terminal value, captured in the second 'steady growth' period. In the first stage we need to estimate the cash flows to the business over the next ten years. Where possible we use analyst estimates, but when these aren't available we extrapolate the previous free cash flow (FCF) from the last estimate or reported value. We assume companies with shrinking free cash flow will slow their rate of shrinkage, and that companies with growing free cash flow will see their growth rate slow, over this period. We do this to reflect that growth tends to slow more in the early years than it does in later years.
A DCF is all about the idea that a dollar in the future is less valuable than a dollar today, so we need to discount the sum of these future cash flows to arrive at a present value estimate:
10-year free cash flow (FCF) estimate
2024 | 2025 | 2026 | 2027 | 2028 | 2029 | 2030 | 2031 | 2032 | 2033 | |
Levered FCF ($, Millions) | US$842.6m | US$1.03b | US$1.29b | US$1.50b | US$1.93b | US$2.22b | US$2.46b | US$2.67b | US$2.85b | US$3.00b |
Growth Rate Estimate Source | Analyst x7 | Analyst x7 | Analyst x5 | Analyst x1 | Analyst x1 | Est @ 14.81% | Est @ 11.08% | Est @ 8.47% | Est @ 6.64% | Est @ 5.37% |
Present Value ($, Millions) Discounted @ 7.8% | US$782 | US$890 | US$1.0k | US$1.1k | US$1.3k | US$1.4k | US$1.5k | US$1.5k | US$1.5k | US$1.4k |
("Est" = FCF growth rate estimated by Simply Wall St)
Present Value of 10-year Cash Flow (PVCF) = US$12b
After calculating the present value of future cash flows in the initial 10-year period, we need to calculate the Terminal Value, which accounts for all future cash flows beyond the first stage. The Gordon Growth formula is used to calculate Terminal Value at a future annual growth rate equal to the 5-year average of the 10-year government bond yield of 2.4%. We discount the terminal cash flows to today's value at a cost of equity of 7.8%.
Terminal Value (TV)= FCF2033 × (1 + g) ÷ (r – g) = US$3.0b× (1 + 2.4%) ÷ (7.8%– 2.4%) = US$57b
Present Value of Terminal Value (PVTV)= TV / (1 + r)10= US$57b÷ ( 1 + 7.8%)10= US$27b
The total value is the sum of cash flows for the next ten years plus the discounted terminal value, which results in the Total Equity Value, which in this case is US$39b. To get the intrinsic value per share, we divide this by the total number of shares outstanding. Compared to the current share price of US$92.2, the company appears about fair value at a 12% discount to where the stock price trades currently. The assumptions in any calculation have a big impact on the valuation, so it is better to view this as a rough estimate, not precise down to the last cent.
Important Assumptions
We would point out that the most important inputs to a discounted cash flow are the discount rate and of course the actual cash flows. Part of investing is coming up with your own evaluation of a company's future performance, so try the calculation yourself and check your own assumptions. The DCF also does not consider the possible cyclicality of an industry, or a company's future capital requirements, so it does not give a full picture of a company's potential performance. Given that we are looking at Vertiv Holdings Co as potential shareholders, the cost of equity is used as the discount rate, rather than the cost of capital (or weighted average cost of capital, WACC) which accounts for debt. In this calculation we've used 7.8%, which is based on a levered beta of 1.170. Beta is a measure of a stock's volatility, compared to the market as a whole. We get our beta from the industry average beta of globally comparable companies, with an imposed limit between 0.8 and 2.0, which is a reasonable range for a stable business.
SWOT Analysis for Vertiv Holdings Co
Strength
Earnings growth over the past year exceeded the industry.
Debt is well covered by earnings and cashflows.
Weakness
Dividend is low compared to the top 25% of dividend payers in the Electrical market.
Opportunity
Annual earnings are forecast to grow faster than the American market.
Current share price is below our estimate of fair value.
Threat
Revenue is forecast to grow slower than 20% per year.
Looking Ahead:
Although the valuation of a company is important, it ideally won't be the sole piece of analysis you scrutinize for a company. It's not possible to obtain a foolproof valuation with a DCF model. Preferably you'd apply different cases and assumptions and see how they would impact the company's valuation. For instance, if the terminal value growth rate is adjusted slightly, it can dramatically alter the overall result. For Vertiv Holdings Co, we've put together three further elements you should consider:
Risks: Consider for instance, the ever-present spectre of investment risk. We've identified 2 warning signs with Vertiv Holdings Co , and understanding them should be part of your investment process.
Management:Have insiders been ramping up their shares to take advantage of the market's sentiment for VRT's future outlook? Check out our management and board analysis with insights on CEO compensation and governance factors.
Other High Quality Alternatives: Do you like a good all-rounder? Explore our interactive list of high quality stocks to get an idea of what else is out there you may be missing!
PS. The Simply Wall St app conducts a discounted cash flow valuation for every stock on the NYSE every day. If you want to find the calculation for other stocks just search here.
Have feedback on this article? Concerned about the content? Get in touch with us directly. Alternatively, email editorial-team (at) simplywallst.com.
This article by Simply Wall St is general in nature. We provide commentary based on historical data and analyst forecasts only using an unbiased methodology and our articles are not intended to be financial advice. It does not constitute a recommendation to buy or sell any stock, and does not take account of your objectives, or your financial situation. We aim to bring you long-term focused analysis driven by fundamental data. Note that our analysis may not factor in the latest price-sensitive company announcements or qualitative material. Simply Wall St has no position in any stocks mentioned.
