
 Yahoo Finance
 There's Been No Shortage Of Growth Recently For DigitalOcean Holdings' (NYSE:DOCN) Returns On Capital
There are a few key trends to look for if we want to identify the next multi-bagger. Firstly, we'll want to see a proven return on capital employed (ROCE) that is increasing, and secondly, an expanding base of capital employed. This shows us that it's a compounding machine, able to continually reinvest its earnings back into the business and generate higher returns. So on that note, DigitalOcean Holdings (NYSE:DOCN) looks quite promising in regards to its trends of return on capital.
What Is Return On Capital Employed (ROCE)?
For those who don't know, ROCE is a measure of a company's yearly pre-tax profit (its return), relative to the capital employed in the business. To calculate this metric for DigitalOcean Holdings, this is the formula:
Return on Capital Employed = Earnings Before Interest and Tax (EBIT) ÷ (Total Assets - Current Liabilities)
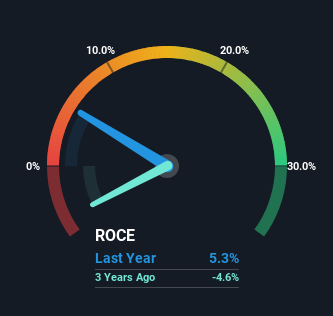
0.053 = US$67m ÷ (US$1.5b - US$193m) (Based on the trailing twelve months to December 2023).
Therefore, DigitalOcean Holdings has an ROCE of 5.3%. In absolute terms, that's a low return and it also under-performs the IT industry average of 13%.
View our latest analysis for DigitalOcean Holdings
Above you can see how the current ROCE for DigitalOcean Holdings compares to its prior returns on capital, but there's only so much you can tell from the past. If you're interested, you can view the analysts predictions in our free analyst report for DigitalOcean Holdings .
How Are Returns Trending?
DigitalOcean Holdings has recently broken into profitability so their prior investments seem to be paying off. Shareholders would no doubt be pleased with this because the business was loss-making five years ago but is is now generating 5.3% on its capital. Not only that, but the company is utilizing 599% more capital than before, but that's to be expected from a company trying to break into profitability. We like this trend, because it tells us the company has profitable reinvestment opportunities available to it, and if it continues going forward that can lead to a multi-bagger performance.
On a related note, the company's ratio of current liabilities to total assets has decreased to 13%, which basically reduces it's funding from the likes of short-term creditors or suppliers. Therefore we can rest assured that the growth in ROCE is a result of the business' fundamental improvements, rather than a cooking class featuring this company's books.
The Key Takeaway
In summary, it's great to see that DigitalOcean Holdings has managed to break into profitability and is continuing to reinvest in its business. Given the stock has declined 24% in the last three years, this could be a good investment if the valuation and other metrics are also appealing. That being the case, research into the company's current valuation metrics and future prospects seems fitting.
Since virtually every company faces some risks, it's worth knowing what they are, and we've spotted 4 warning signs for DigitalOcean Holdings (of which 2 are a bit concerning!) that you should know about.
While DigitalOcean Holdings isn't earning the highest return, check out this free list of companies that are earning high returns on equity with solid balance sheets.
Have feedback on this article? Concerned about the content? Get in touch with us directly. Alternatively, email editorial-team (at) simplywallst.com.
This article by Simply Wall St is general in nature. We provide commentary based on historical data and analyst forecasts only using an unbiased methodology and our articles are not intended to be financial advice. It does not constitute a recommendation to buy or sell any stock, and does not take account of your objectives, or your financial situation. We aim to bring you long-term focused analysis driven by fundamental data. Note that our analysis may not factor in the latest price-sensitive company announcements or qualitative material. Simply Wall St has no position in any stocks mentioned.
