
Snap-on's (NYSE:SNA) Investors Will Be Pleased With Their Respectable 81% Return Over the Last Five Years
Snap-on's (NYSE:SNA) Investors Will Be Pleased With Their Respectable 81% Return Over the Last Five Years
If you buy and hold a stock for many years, you'd hope to be making a profit. Better yet, you'd like to see the share price move up more than the market average. Unfortunately for shareholders, while the Snap-on Incorporated (NYSE:SNA) share price is up 59% in the last five years, that's less than the market return. The last year hasn't been great either, with the stock up just 2.2%.
如果你買入並持有股票多年,你希望獲利。更好的是,你希望看到股價的上漲幅度超過市場平均水平。對於股東來說,不幸的是,儘管Snap-on Incorporated(紐約證券交易所代碼:SNA)的股價在過去五年中上漲了59%,但仍低於市場回報率。去年也不是很好,該股僅上漲了2.2%。
With that in mind, it's worth seeing if the company's underlying fundamentals have been the driver of long term performance, or if there are some discrepancies.
考慮到這一點,值得一看公司的基本面是否是長期業績的驅動力,或者是否存在一些差異。
There is no denying that markets are sometimes efficient, but prices do not always reflect underlying business performance. One way to examine how market sentiment has changed over time is to look at the interaction between a company's share price and its earnings per share (EPS).
不可否認,市場有時是有效的,但價格並不總是能反映潛在的業務表現。研究市場情緒如何隨着時間的推移而變化的一種方法是研究公司股價與其每股收益(EPS)之間的相互作用。
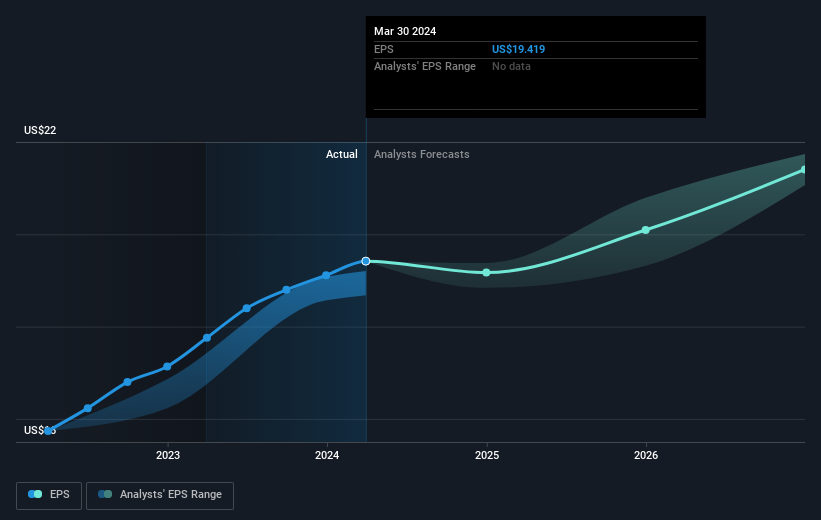
Over half a decade, Snap-on managed to grow its earnings per share at 9.4% a year. That makes the EPS growth particularly close to the yearly share price growth of 10%. That suggests that the market sentiment around the company hasn't changed much over that time. In fact, the share price seems to largely reflect the EPS growth.
在過去的五年中,Snap-on設法將其每股收益增長到每年9.4%。這使得每股收益的增長特別接近10%的年度股價增長。這表明,在那段時間內,公司周圍的市場情緒沒有太大變化。實際上,股價似乎在很大程度上反映了每股收益的增長。
You can see below how EPS has changed over time (discover the exact values by clicking on the image).
你可以在下面看到 EPS 是如何隨着時間的推移而變化的(點擊圖片發現確切的值)。
Before buying or selling a stock, we always recommend a close examination of historic growth trends, available here.
在買入或賣出股票之前,我們始終建議仔細研究歷史增長趨勢,可在此處查閱。
What About Dividends?
分紅呢?
It is important to consider the total shareholder return, as well as the share price return, for any given stock. Whereas the share price return only reflects the change in the share price, the TSR includes the value of dividends (assuming they were reinvested) and the benefit of any discounted capital raising or spin-off. So for companies that pay a generous dividend, the TSR is often a lot higher than the share price return. We note that for Snap-on the TSR over the last 5 years was 81%, which is better than the share price return mentioned above. This is largely a result of its dividend payments!
重要的是要考慮任何給定股票的股東總回報率和股價回報率。儘管股價回報率僅反映股價的變化,但股東總回報率包括股息的價值(假設已進行再投資)以及任何折扣融資或分拆的收益。因此,對於支付豐厚股息的公司來說,股東總回報率通常遠高於股價回報率。我們注意到,Snap-on在過去5年的股東總回報率爲81%,好於上述股價回報率。這在很大程度上是其股息支付的結果!
A Different Perspective
不同的視角
Snap-on provided a TSR of 4.9% over the last twelve months. But that was short of the market average. On the bright side, the longer term returns (running at about 13% a year, over half a decade) look better. Maybe the share price is just taking a breather while the business executes on its growth strategy. While it is well worth considering the different impacts that market conditions can have on the share price, there are other factors that are even more important. Take risks, for example - Snap-on has 1 warning sign we think you should be aware of.
在過去的十二個月中,Snap-on的股東回報率爲4.9%。但這低於市場平均水平。好的一面是,長期回報(超過五年,每年約13%)看起來更好。也許在企業執行增長戰略的同時,股價只是在稍作休息。儘管市場狀況可能對股價產生的不同影響值得考慮,但還有其他因素更爲重要。例如,冒險吧——Snap-on 有 1 個我們認爲你應該注意的警告信號。
If you like to buy stocks alongside management, then you might just love this free list of companies. (Hint: insiders have been buying them).
如果你想與管理層一起購買股票,那麼你可能會喜歡這份免費的公司名單。(提示:業內人士一直在購買它們)。
Please note, the market returns quoted in this article reflect the market weighted average returns of stocks that currently trade on American exchanges.
請注意,本文引用的市場回報反映了目前在美國交易所交易的股票的市場加權平均回報。
Have feedback on this article? Concerned about the content? Get in touch with us directly. Alternatively, email editorial-team (at) simplywallst.com.
This article by Simply Wall St is general in nature. We provide commentary based on historical data and analyst forecasts only using an unbiased methodology and our articles are not intended to be financial advice. It does not constitute a recommendation to buy or sell any stock, and does not take account of your objectives, or your financial situation. We aim to bring you long-term focused analysis driven by fundamental data. Note that our analysis may not factor in the latest price-sensitive company announcements or qualitative material. Simply Wall St has no position in any stocks mentioned.
對這篇文章有反饋嗎?對內容感到擔憂?直接聯繫我們。 或者,給編輯團隊 (at) simplywallst.com 發送電子郵件。
Simply Wall St的這篇文章本質上是籠統的。我們僅使用公正的方法根據歷史數據和分析師的預測提供評論,我們的文章無意作爲財務建議。它不構成買入或賣出任何股票的建議,也沒有考慮到您的目標或財務狀況。我們的目標是爲您提供由基本數據驅動的長期重點分析。請注意,我們的分析可能不考慮最新的價格敏感型公司公告或定性材料。簡而言之,華爾街沒有持有任何上述股票的頭寸。
譯文內容由第三人軟體翻譯。