
We Think You Can Look Beyond Lam Research's (NASDAQ:LRCX) Lackluster Earnings
We Think You Can Look Beyond Lam Research's (NASDAQ:LRCX) Lackluster Earnings
The market was pleased with the recent earnings report from Lam Research Corporation (NASDAQ:LRCX), despite the profit numbers being soft. Our analysis suggests that investors may have noticed some promising signs beyond the statutory profit figures.
儘管利潤數字疲軟,但市場對林業研究公司(納斯達克股票代碼:LRCX)最近的收益報告感到滿意。我們的分析表明,除了法定利潤數字外,投資者可能已經注意到一些令人鼓舞的跡象。
Examining Cashflow Against Lam Research's Earnings
將現金流與 Lam Research 的收益進行比較
In high finance, the key ratio used to measure how well a company converts reported profits into free cash flow (FCF) is the accrual ratio (from cashflow). To get the accrual ratio we first subtract FCF from profit for a period, and then divide that number by the average operating assets for the period. The ratio shows us how much a company's profit exceeds its FCF.
在高級財務中,用於衡量公司將報告的利潤轉換爲自由現金流(FCF)的關鍵比率是應計比率(來自現金流)。爲了獲得應計比率,我們首先從一段時期的利潤中減去FCF,然後將該數字除以該期間的平均運營資產。該比率向我們顯示了公司的利潤超過其FCF的程度。
That means a negative accrual ratio is a good thing, because it shows that the company is bringing in more free cash flow than its profit would suggest. That is not intended to imply we should worry about a positive accrual ratio, but it's worth noting where the accrual ratio is rather high. Notably, there is some academic evidence that suggests that a high accrual ratio is a bad sign for near-term profits, generally speaking.
這意味着負應計比率是一件好事,因爲它表明該公司帶來的自由現金流比其利潤所暗示的要多。這並不意味着我們應該擔心應計比率爲正,但值得注意的是,應計比率相當高的地方。值得注意的是,有一些學術證據表明,總的來說,高應計率對短期利潤來說是個壞兆頭。
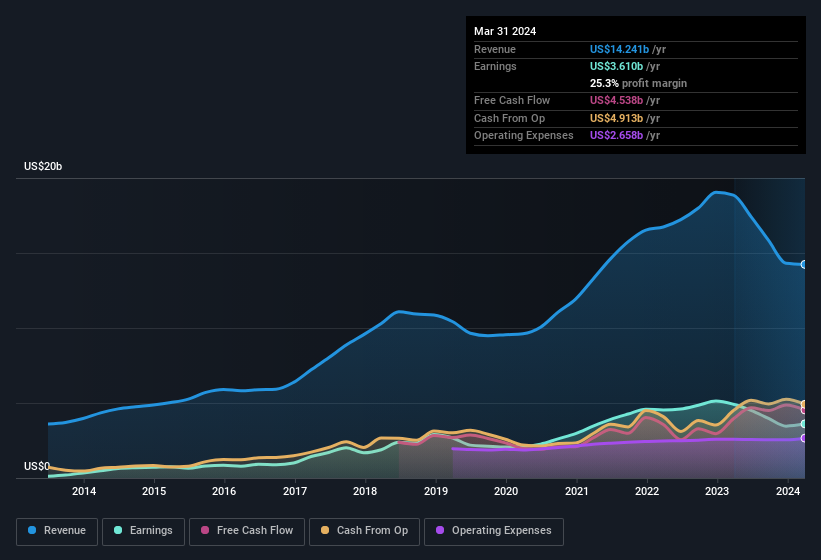
Over the twelve months to March 2024, Lam Research recorded an accrual ratio of -0.12. Therefore, its statutory earnings were quite a lot less than its free cashflow. Indeed, in the last twelve months it reported free cash flow of US$4.5b, well over the US$3.61b it reported in profit. Lam Research shareholders are no doubt pleased that free cash flow improved over the last twelve months.
在截至2024年3月的十二個月中,林研的應計比率爲-0.12。因此,其法定收入遠遠低於其自由現金流。事實上,在過去的十二個月中,它報告的自由現金流爲45億美元,遠高於其公佈的36.1億美元的利潤。Lam Research的股東們無疑對過去十二個月自由現金流的改善感到高興。
That might leave you wondering what analysts are forecasting in terms of future profitability. Luckily, you can click here to see an interactive graph depicting future profitability, based on their estimates.
這可能會讓你想知道分析師對未來盈利能力的預測。幸運的是,您可以單擊此處查看根據他們的估計描繪未來盈利能力的交互式圖表。
Our Take On Lam Research's Profit Performance
我們對Lam Research利潤表現的看法
As we discussed above, Lam Research has perfectly satisfactory free cash flow relative to profit. Because of this, we think Lam Research's earnings potential is at least as good as it seems, and maybe even better! And on top of that, its earnings per share have grown at 13% per year over the last three years. At the end of the day, it's essential to consider more than just the factors above, if you want to understand the company properly. So if you'd like to dive deeper into this stock, it's crucial to consider any risks it's facing. For example - Lam Research has 1 warning sign we think you should be aware of.
正如我們上面討論的那樣,Lam Research的自由現金流相對於利潤來說非常令人滿意。因此,我們認爲Lam Research的盈利潛力至少和看起來一樣好,甚至可能更好!最重要的是,在過去三年中,其每股收益以每年13%的速度增長。歸根結底,如果你想正確地了解公司,必須考慮的不僅僅是上述因素。因此,如果你想更深入地研究這隻股票,那麼考慮它面臨的任何風險至關重要。例如,Lam Research有1個警告信號,我們認爲你應該注意。
This note has only looked at a single factor that sheds light on the nature of Lam Research's profit. But there are plenty of other ways to inform your opinion of a company. Some people consider a high return on equity to be a good sign of a quality business. So you may wish to see this free collection of companies boasting high return on equity, or this list of stocks that insiders are buying.
這份報告只研究了闡明林研究利潤性質的單一因素。但是,還有很多其他方法可以讓你對公司的看法。有些人認爲高股本回報率是優質業務的好兆頭。因此,你可能希望看到這份免費收藏的擁有高股本回報率的公司,或者這份內部人士正在購買的股票清單。
Have feedback on this article? Concerned about the content? Get in touch with us directly. Alternatively, email editorial-team (at) simplywallst.com.
This article by Simply Wall St is general in nature. We provide commentary based on historical data and analyst forecasts only using an unbiased methodology and our articles are not intended to be financial advice. It does not constitute a recommendation to buy or sell any stock, and does not take account of your objectives, or your financial situation. We aim to bring you long-term focused analysis driven by fundamental data. Note that our analysis may not factor in the latest price-sensitive company announcements or qualitative material. Simply Wall St has no position in any stocks mentioned.
對這篇文章有反饋嗎?對內容感到擔憂?直接聯繫我們。 或者,給編輯團隊 (at) simplywallst.com 發送電子郵件。
Simply Wall St的這篇文章本質上是籠統的。我們僅使用公正的方法根據歷史數據和分析師的預測提供評論,我們的文章無意作爲財務建議。它不構成買入或賣出任何股票的建議,也沒有考慮到您的目標或財務狀況。我們的目標是爲您提供由基本數據驅動的長期重點分析。請注意,我們的分析可能不考慮最新的價格敏感型公司公告或定性材料。簡而言之,華爾街沒有持有任何上述股票的頭寸。
譯文內容由第三人軟體翻譯。