
Warren Buffett famously said, 'Volatility is far from synonymous with risk.' When we think about how risky a company is, we always like to look at its use of debt, since debt overload can lead to ruin. We note that UOL Group Limited (SGX:U14) does have debt on its balance sheet. But is this debt a concern to shareholders?
Why Does Debt Bring Risk?
Debt is a tool to help businesses grow, but if a business is incapable of paying off its lenders, then it exists at their mercy. Ultimately, if the company can't fulfill its legal obligations to repay debt, shareholders could walk away with nothing. While that is not too common, we often do see indebted companies permanently diluting shareholders because lenders force them to raise capital at a distressed price. Of course, the upside of debt is that it often represents cheap capital, especially when it replaces dilution in a company with the ability to reinvest at high rates of return. When we think about a company's use of debt, we first look at cash and debt together.
What Is UOL Group's Net Debt?
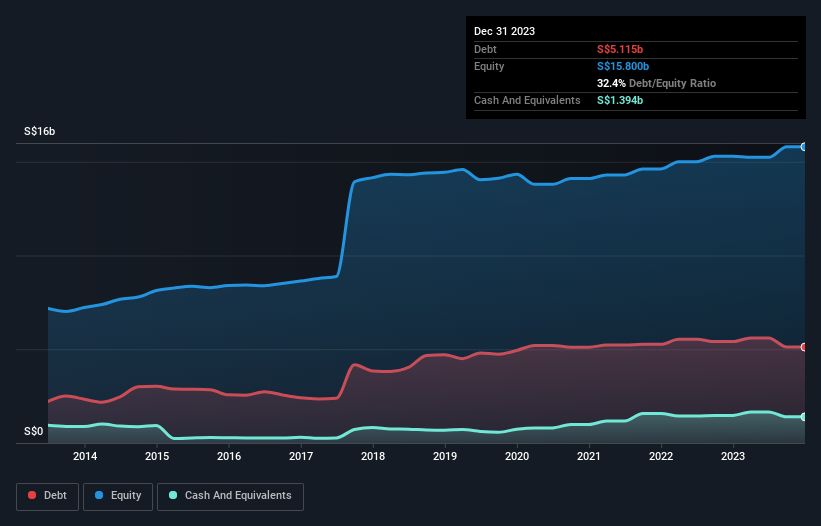
As you can see below, UOL Group had S$5.12b of debt at December 2023, down from S$5.41b a year prior. However, it also had S$1.39b in cash, and so its net debt is S$3.72b.
How Healthy Is UOL Group's Balance Sheet?
The latest balance sheet data shows that UOL Group had liabilities of S$1.53b due within a year, and liabilities of S$4.87b falling due after that. On the other hand, it had cash of S$1.39b and S$3.30b worth of receivables due within a year. So it has liabilities totalling S$1.70b more than its cash and near-term receivables, combined.
UOL Group has a market capitalization of S$4.95b, so it could very likely raise cash to ameliorate its balance sheet, if the need arose. However, it is still worthwhile taking a close look at its ability to pay off debt.
We measure a company's debt load relative to its earnings power by looking at its net debt divided by its earnings before interest, tax, depreciation, and amortization (EBITDA) and by calculating how easily its earnings before interest and tax (EBIT) cover its interest expense (interest cover). The advantage of this approach is that we take into account both the absolute quantum of debt (with net debt to EBITDA) and the actual interest expenses associated with that debt (with its interest cover ratio).
UOL Group has a debt to EBITDA ratio of 4.9 and its EBIT covered its interest expense 4.1 times. Taken together this implies that, while we wouldn't want to see debt levels rise, we think it can handle its current leverage. More concerning, UOL Group saw its EBIT drop by 7.3% in the last twelve months. If that earnings trend continues the company will face an uphill battle to pay off its debt. There's no doubt that we learn most about debt from the balance sheet. But ultimately the future profitability of the business will decide if UOL Group can strengthen its balance sheet over time. So if you're focused on the future you can check out this free report showing analyst profit forecasts.
Finally, a company can only pay off debt with cold hard cash, not accounting profits. So the logical step is to look at the proportion of that EBIT that is matched by actual free cash flow. Looking at the most recent three years, UOL Group recorded free cash flow of 40% of its EBIT, which is weaker than we'd expect. That's not great, when it comes to paying down debt.
Our View
UOL Group's net debt to EBITDA was a real negative on this analysis, although the other factors we considered cast it in a significantly better light. For example, its level of total liabilities is relatively strong. When we consider all the factors discussed, it seems to us that UOL Group is taking some risks with its use of debt. So while that leverage does boost returns on equity, we wouldn't really want to see it increase from here. When analysing debt levels, the balance sheet is the obvious place to start. However, not all investment risk resides within the balance sheet - far from it. For example UOL Group has 2 warning signs (and 1 which can't be ignored) we think you should know about.
If, after all that, you're more interested in a fast growing company with a rock-solid balance sheet, then check out our list of net cash growth stocks without delay.
Have feedback on this article? Concerned about the content? Get in touch with us directly. Alternatively, email editorial-team (at) simplywallst.com.
This article by Simply Wall St is general in nature. We provide commentary based on historical data and analyst forecasts only using an unbiased methodology and our articles are not intended to be financial advice. It does not constitute a recommendation to buy or sell any stock, and does not take account of your objectives, or your financial situation. We aim to bring you long-term focused analysis driven by fundamental data. Note that our analysis may not factor in the latest price-sensitive company announcements or qualitative material. Simply Wall St has no position in any stocks mentioned.