
Science Applications International's (NASDAQ:SAIC) Five-year Earnings Growth Trails the 13% YoY Shareholder Returns
Science Applications International's (NASDAQ:SAIC) Five-year Earnings Growth Trails the 13% YoY Shareholder Returns
The simplest way to invest in stocks is to buy exchange traded funds. But the truth is, you can make significant gains if you buy good quality businesses at the right price. For example, the Science Applications International Corporation (NASDAQ:SAIC) share price is 70% higher than it was five years ago, which is more than the market average. It's also good to see a healthy gain of 26% in the last year.
投資股票的最簡單方法是購買交易所交易基金。但事實是,如果你以合適的價格購買高質量的企業,你可以獲得可觀的收益。例如,科學應用國際公司(納斯達克股票代碼:SAIC)的股價比五年前高出70%,高於市場平均水平。去年也很高興看到26%的健康增長。
The past week has proven to be lucrative for Science Applications International investors, so let's see if fundamentals drove the company's five-year performance.
事實證明,過去一週對科學應用國際投資者來說是有利可圖的,因此,讓我們看看基本面是否推動了該公司的五年業績。
To paraphrase Benjamin Graham: Over the short term the market is a voting machine, but over the long term it's a weighing machine. One imperfect but simple way to consider how the market perception of a company has shifted is to compare the change in the earnings per share (EPS) with the share price movement.
用本傑明·格雷厄姆的話來說:從短期來看,市場是一臺投票機器,但從長遠來看,它是一臺稱重機。考慮市場對公司的看法發生了怎樣的變化的一種不完美但簡單的方法是將每股收益(EPS)的變化與股價走勢進行比較。
During five years of share price growth, Science Applications International achieved compound earnings per share (EPS) growth of 24% per year. This EPS growth is higher than the 11% average annual increase in the share price. So one could conclude that the broader market has become more cautious towards the stock.
在五年的股價增長中,科學應用國際實現了每年24%的複合每股收益(EPS)增長。每股收益的增長高於股價每年平均增長11%。因此,人們可以得出結論,整個市場對該股變得更加謹慎。
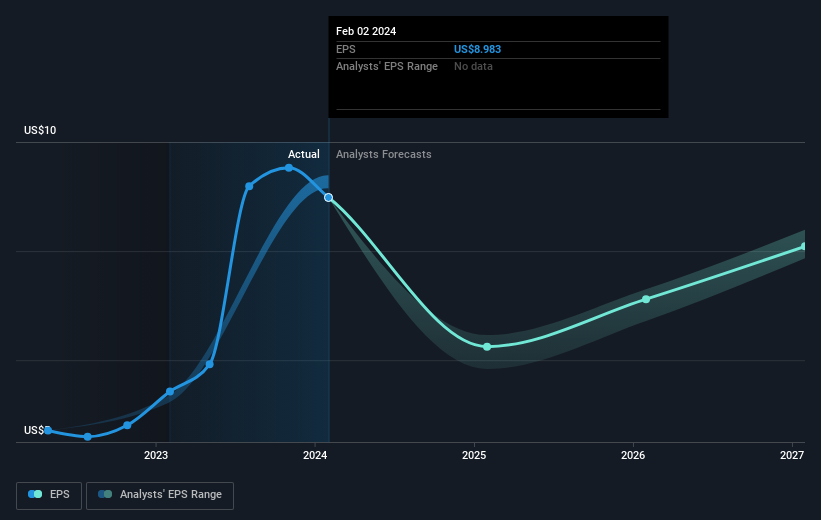
The graphic below depicts how EPS has changed over time (unveil the exact values by clicking on the image).
下圖描述了 EPS 隨着時間的推移是如何變化的(點擊圖片可以看到確切的值)。
It's good to see that there was some significant insider buying in the last three months. That's a positive. On the other hand, we think the revenue and earnings trends are much more meaningful measures of the business. It might be well worthwhile taking a look at our free report on Science Applications International's earnings, revenue and cash flow.
很高興看到在過去三個月中出現了一些大規模的內幕買盤。這是積極的。另一方面,我們認爲收入和收益趨勢是衡量業務的更有意義的指標。可能值得一看我們關於國際科學應用組織收益、收入和現金流的免費報告。
What About Dividends?
分紅呢?
It is important to consider the total shareholder return, as well as the share price return, for any given stock. Whereas the share price return only reflects the change in the share price, the TSR includes the value of dividends (assuming they were reinvested) and the benefit of any discounted capital raising or spin-off. It's fair to say that the TSR gives a more complete picture for stocks that pay a dividend. We note that for Science Applications International the TSR over the last 5 years was 84%, which is better than the share price return mentioned above. This is largely a result of its dividend payments!
重要的是要考慮任何給定股票的股東總回報率和股價回報率。儘管股價回報率僅反映股價的變化,但股東總回報率包括股息的價值(假設已進行再投資)以及任何折扣融資或分拆的收益。可以公平地說,股東總回報率爲支付股息的股票提供了更完整的畫面。我們注意到,對於科學應用國際而言,過去5年的股東總回報率爲84%,好於上述股價回報率。這在很大程度上是其股息支付的結果!
A Different Perspective
不同的視角
We're pleased to report that Science Applications International shareholders have received a total shareholder return of 28% over one year. Of course, that includes the dividend. That gain is better than the annual TSR over five years, which is 13%. Therefore it seems like sentiment around the company has been positive lately. Someone with an optimistic perspective could view the recent improvement in TSR as indicating that the business itself is getting better with time. I find it very interesting to look at share price over the long term as a proxy for business performance. But to truly gain insight, we need to consider other information, too. Like risks, for instance. Every company has them, and we've spotted 3 warning signs for Science Applications International (of which 2 don't sit too well with us!) you should know about.
我們很高興地向大家報告,科學應用國際的股東在一年內獲得了28%的總股東回報率。當然,這包括股息。這一增幅好於五年內的年度股東總回報率,即13%。因此,最近公司周圍的情緒似乎一直很樂觀。持樂觀態度的人可能會將最近股東總回報率的改善視爲業務本身隨着時間的推移而變得更好。我發現將長期股價視爲業務績效的代表非常有趣。但是,要真正獲得見解,我們還需要考慮其他信息。比如風險。每家公司都有它們,我們已經發現了《科學應用國際》的3個警告標誌(其中2個對我們來說不太合適!)你應該知道。
If you like to buy stocks alongside management, then you might just love this free list of companies. (Hint: insiders have been buying them).
如果你想與管理層一起購買股票,那麼你可能會喜歡這份免費的公司名單。(提示:業內人士一直在購買它們)。
Please note, the market returns quoted in this article reflect the market weighted average returns of stocks that currently trade on American exchanges.
請注意,本文引用的市場回報反映了目前在美國交易所交易的股票的市場加權平均回報。
Have feedback on this article? Concerned about the content? Get in touch with us directly. Alternatively, email editorial-team (at) simplywallst.com.
This article by Simply Wall St is general in nature. We provide commentary based on historical data and analyst forecasts only using an unbiased methodology and our articles are not intended to be financial advice. It does not constitute a recommendation to buy or sell any stock, and does not take account of your objectives, or your financial situation. We aim to bring you long-term focused analysis driven by fundamental data. Note that our analysis may not factor in the latest price-sensitive company announcements or qualitative material. Simply Wall St has no position in any stocks mentioned.
對這篇文章有反饋嗎?對內容感到擔憂?直接聯繫我們。 或者,給編輯團隊 (at) simplywallst.com 發送電子郵件。
Simply Wall St的這篇文章本質上是籠統的。我們僅使用公正的方法根據歷史數據和分析師的預測提供評論,我們的文章無意作爲財務建議。它不構成買入或賣出任何股票的建議,也沒有考慮到您的目標或財務狀況。我們的目標是爲您提供由基本數據驅動的長期重點分析。請注意,我們的分析可能不考慮最新的價格敏感型公司公告或定性材料。簡而言之,華爾街沒有持有任何上述股票的頭寸。
譯文內容由第三人軟體翻譯。