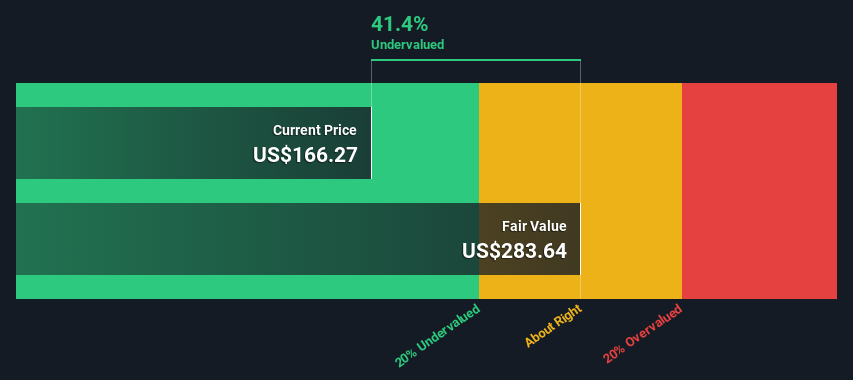
Using the 2 Stage Free Cash Flow to Equity, Regal Rexnord fair value estimate is US$284
Regal Rexnord is estimated to be 41% undervalued based on current share price of US$166
The US$195 analyst price target for RRX is 31% less than our estimate of fair value
In this article we are going to estimate the intrinsic value of Regal Rexnord Corporation (NYSE:RRX) by taking the expected future cash flows and discounting them to today's value. We will use the Discounted Cash Flow (DCF) model on this occasion. Believe it or not, it's not too difficult to follow, as you'll see from our example!
We would caution that there are many ways of valuing a company and, like the DCF, each technique has advantages and disadvantages in certain scenarios. For those who are keen learners of equity analysis, the Simply Wall St analysis model here may be something of interest to you.
Crunching The Numbers
We are going to use a two-stage DCF model, which, as the name states, takes into account two stages of growth. The first stage is generally a higher growth period which levels off heading towards the terminal value, captured in the second 'steady growth' period. To start off with, we need to estimate the next ten years of cash flows. Where possible we use analyst estimates, but when these aren't available we extrapolate the previous free cash flow (FCF) from the last estimate or reported value. We assume companies with shrinking free cash flow will slow their rate of shrinkage, and that companies with growing free cash flow will see their growth rate slow, over this period. We do this to reflect that growth tends to slow more in the early years than it does in later years.
Generally we assume that a dollar today is more valuable than a dollar in the future, so we discount the value of these future cash flows to their estimated value in today's dollars:
10-year free cash flow (FCF) estimate
2024
2025
2026
2027
2028
2029
2030
2031
2032
2033
Levered FCF ($, Millions)
US$732.4m
US$941.1m
US$1.10b
US$1.24b
US$1.35b
US$1.45b
US$1.53b
US$1.60b
US$1.67b
US$1.73b
Growth Rate Estimate Source
Analyst x4
Analyst x6
Est @ 16.75%
Est @ 12.41%
Est @ 9.38%
Est @ 7.25%
Est @ 5.76%
Est @ 4.72%
Est @ 3.99%
Est @ 3.48%
Present Value ($, Millions) Discounted @ 9.1%
US$671
US$790
US$846
US$872
US$874
US$859
US$832
US$799
US$762
US$722
("Est" = FCF growth rate estimated by Simply Wall St) Present Value of 10-year Cash Flow (PVCF) = US$8.0b
The second stage is also known as Terminal Value, this is the business's cash flow after the first stage. The Gordon Growth formula is used to calculate Terminal Value at a future annual growth rate equal to the 5-year average of the 10-year government bond yield of 2.3%. We discount the terminal cash flows to today's value at a cost of equity of 9.1%.
Present Value of Terminal Value (PVTV)= TV / (1 + r)10= US$26b÷ ( 1 + 9.1%)10= US$11b
The total value, or equity value, is then the sum of the present value of the future cash flows, which in this case is US$19b. In the final step we divide the equity value by the number of shares outstanding. Relative to the current share price of US$166, the company appears quite undervalued at a 41% discount to where the stock price trades currently. The assumptions in any calculation have a big impact on the valuation, so it is better to view this as a rough estimate, not precise down to the last cent.
NYSE:RRX Discounted Cash Flow April 30th 2024
The Assumptions
The calculation above is very dependent on two assumptions. The first is the discount rate and the other is the cash flows. If you don't agree with these result, have a go at the calculation yourself and play with the assumptions. The DCF also does not consider the possible cyclicality of an industry, or a company's future capital requirements, so it does not give a full picture of a company's potential performance. Given that we are looking at Regal Rexnord as potential shareholders, the cost of equity is used as the discount rate, rather than the cost of capital (or weighted average cost of capital, WACC) which accounts for debt. In this calculation we've used 9.1%, which is based on a levered beta of 1.482. Beta is a measure of a stock's volatility, compared to the market as a whole. We get our beta from the industry average beta of globally comparable companies, with an imposed limit between 0.8 and 2.0, which is a reasonable range for a stable business.
SWOT Analysis for Regal Rexnord
Strength
No major strengths identified for RRX.
Weakness
Interest payments on debt are not well covered.
Dividend is low compared to the top 25% of dividend payers in the Electrical market.
Opportunity
Expected to breakeven next year.
Has sufficient cash runway for more than 3 years based on current free cash flows.
Good value based on P/S ratio and estimated fair value.
Have RRX insiders been buying lately?
Threat
Debt is not well covered by operating cash flow.
Paying a dividend but company is unprofitable.
Is RRX well equipped to handle threats?
Moving On:
Whilst important, the DCF calculation ideally won't be the sole piece of analysis you scrutinize for a company. DCF models are not the be-all and end-all of investment valuation. Preferably you'd apply different cases and assumptions and see how they would impact the company's valuation. For example, changes in the company's cost of equity or the risk free rate can significantly impact the valuation. Can we work out why the company is trading at a discount to intrinsic value? For Regal Rexnord, we've put together three further factors you should further research:
Risks: Consider for instance, the ever-present spectre of investment risk. We've identified 1 warning sign with Regal Rexnord , and understanding this should be part of your investment process.
Future Earnings: How does RRX's growth rate compare to its peers and the wider market? Dig deeper into the analyst consensus number for the upcoming years by interacting with our free analyst growth expectation chart.
Other Solid Businesses: Low debt, high returns on equity and good past performance are fundamental to a strong business. Why not explore our interactive list of stocks with solid business fundamentals to see if there are other companies you may not have considered!
PS. The Simply Wall St app conducts a discounted cash flow valuation for every stock on the NYSE every day. If you want to find the calculation for other stocks just search here.
Have feedback on this article? Concerned about the content?Get in touch with us directly. Alternatively, email editorial-team (at) simplywallst.com. This article by Simply Wall St is general in nature. We provide commentary based on historical data and analyst forecasts only using an unbiased methodology and our articles are not intended to be financial advice. It does not constitute a recommendation to buy or sell any stock, and does not take account of your objectives, or your financial situation. We aim to bring you long-term focused analysis driven by fundamental data. Note that our analysis may not factor in the latest price-sensitive company announcements or qualitative material. Simply Wall St has no position in any stocks mentioned.