
 Yahoo Finance
 Is There An Opportunity With Genting Malaysia Berhad's (KLSE:GENM) 36% Undervaluation?
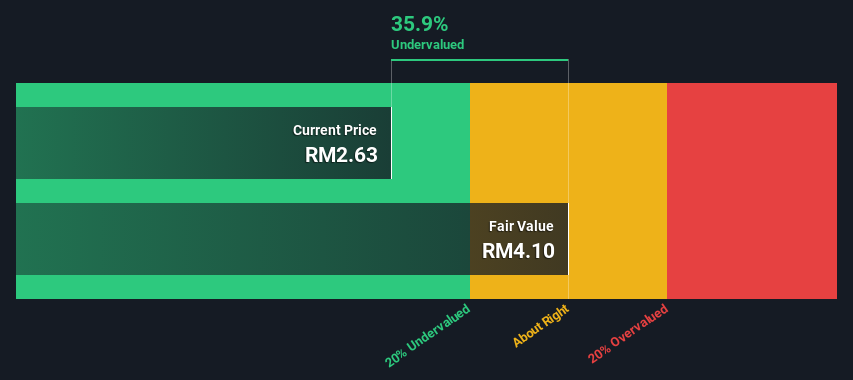
Key Insights
Genting Malaysia Berhad's estimated fair value is RM4.10 based on 2 Stage Free Cash Flow to Equity
Current share price of RM2.63 suggests Genting Malaysia Berhad is potentially 36% undervalued
The RM3.22 analyst price target for GENM is 22% less than our estimate of fair value
Does the April share price for Genting Malaysia Berhad (KLSE:GENM) reflect what it's really worth? Today, we will estimate the stock's intrinsic value by taking the expected future cash flows and discounting them to their present value. We will use the Discounted Cash Flow (DCF) model on this occasion. Before you think you won't be able to understand it, just read on! It's actually much less complex than you'd imagine.
Remember though, that there are many ways to estimate a company's value, and a DCF is just one method. If you want to learn more about discounted cash flow, the rationale behind this calculation can be read in detail in the Simply Wall St analysis model.
View our latest analysis for Genting Malaysia Berhad
The Method
We use what is known as a 2-stage model, which simply means we have two different periods of growth rates for the company's cash flows. Generally the first stage is higher growth, and the second stage is a lower growth phase. In the first stage we need to estimate the cash flows to the business over the next ten years. Where possible we use analyst estimates, but when these aren't available we extrapolate the previous free cash flow (FCF) from the last estimate or reported value. We assume companies with shrinking free cash flow will slow their rate of shrinkage, and that companies with growing free cash flow will see their growth rate slow, over this period. We do this to reflect that growth tends to slow more in the early years than it does in later years.
Generally we assume that a dollar today is more valuable than a dollar in the future, and so the sum of these future cash flows is then discounted to today's value:
10-year free cash flow (FCF) estimate
2024 | 2025 | 2026 | 2027 | 2028 | 2029 | 2030 | 2031 | 2032 | 2033 | |
Levered FCF (MYR, Millions) | RM2.27b | RM2.41b | RM2.53b | RM2.63b | RM2.73b | RM2.83b | RM2.93b | RM3.04b | RM3.15b | RM3.27b |
Growth Rate Estimate Source | Analyst x3 | Analyst x3 | Analyst x2 | Est @ 4.00% | Est @ 3.86% | Est @ 3.76% | Est @ 3.70% | Est @ 3.65% | Est @ 3.62% | Est @ 3.59% |
Present Value (MYR, Millions) Discounted @ 14% | RM2.0k | RM1.9k | RM1.7k | RM1.6k | RM1.4k | RM1.3k | RM1.2k | RM1.1k | RM991 | RM903 |
("Est" = FCF growth rate estimated by Simply Wall St)
Present Value of 10-year Cash Flow (PVCF) = RM14b
After calculating the present value of future cash flows in the initial 10-year period, we need to calculate the Terminal Value, which accounts for all future cash flows beyond the first stage. The Gordon Growth formula is used to calculate Terminal Value at a future annual growth rate equal to the 5-year average of the 10-year government bond yield of 3.5%. We discount the terminal cash flows to today's value at a cost of equity of 14%.
Terminal Value (TV)= FCF2033 × (1 + g) ÷ (r – g) = RM3.3b× (1 + 3.5%) ÷ (14%– 3.5%) = RM33b
Present Value of Terminal Value (PVTV)= TV / (1 + r)10= RM33b÷ ( 1 + 14%)10= RM9.2b
The total value, or equity value, is then the sum of the present value of the future cash flows, which in this case is RM23b. In the final step we divide the equity value by the number of shares outstanding. Compared to the current share price of RM2.6, the company appears quite good value at a 36% discount to where the stock price trades currently. Remember though, that this is just an approximate valuation, and like any complex formula - garbage in, garbage out.
The Assumptions
Now the most important inputs to a discounted cash flow are the discount rate, and of course, the actual cash flows. You don't have to agree with these inputs, I recommend redoing the calculations yourself and playing with them. The DCF also does not consider the possible cyclicality of an industry, or a company's future capital requirements, so it does not give a full picture of a company's potential performance. Given that we are looking at Genting Malaysia Berhad as potential shareholders, the cost of equity is used as the discount rate, rather than the cost of capital (or weighted average cost of capital, WACC) which accounts for debt. In this calculation we've used 14%, which is based on a levered beta of 1.603. Beta is a measure of a stock's volatility, compared to the market as a whole. We get our beta from the industry average beta of globally comparable companies, with an imposed limit between 0.8 and 2.0, which is a reasonable range for a stable business.
SWOT Analysis for Genting Malaysia Berhad
Strength
Debt is well covered by earnings.
Dividend is in the top 25% of dividend payers in the market.
Weakness
No major weaknesses identified for GENM.
Opportunity
Annual earnings are forecast to grow faster than the Malaysian market.
Trading below our estimate of fair value by more than 20%.
Threat
Debt is not well covered by operating cash flow.
Dividends are not covered by earnings.
Annual revenue is forecast to grow slower than the Malaysian market.
Moving On:
Whilst important, the DCF calculation is only one of many factors that you need to assess for a company. It's not possible to obtain a foolproof valuation with a DCF model. Instead the best use for a DCF model is to test certain assumptions and theories to see if they would lead to the company being undervalued or overvalued. If a company grows at a different rate, or if its cost of equity or risk free rate changes sharply, the output can look very different. Why is the intrinsic value higher than the current share price? For Genting Malaysia Berhad, we've put together three further factors you should further research:
Risks: Consider for instance, the ever-present spectre of investment risk. We've identified 2 warning signs with Genting Malaysia Berhad (at least 1 which can't be ignored) , and understanding these should be part of your investment process.
Future Earnings: How does GENM's growth rate compare to its peers and the wider market? Dig deeper into the analyst consensus number for the upcoming years by interacting with our free analyst growth expectation chart.
Other High Quality Alternatives: Do you like a good all-rounder? Explore our interactive list of high quality stocks to get an idea of what else is out there you may be missing!
PS. The Simply Wall St app conducts a discounted cash flow valuation for every stock on the KLSE every day. If you want to find the calculation for other stocks just search here.
Have feedback on this article? Concerned about the content? Get in touch with us directly. Alternatively, email editorial-team (at) simplywallst.com.
This article by Simply Wall St is general in nature. We provide commentary based on historical data and analyst forecasts only using an unbiased methodology and our articles are not intended to be financial advice. It does not constitute a recommendation to buy or sell any stock, and does not take account of your objectives, or your financial situation. We aim to bring you long-term focused analysis driven by fundamental data. Note that our analysis may not factor in the latest price-sensitive company announcements or qualitative material. Simply Wall St has no position in any stocks mentioned.
