
Balchem's (NASDAQ:BCPC) Earnings Growth Rate Lags the 7.3% CAGR Delivered to Shareholders
Balchem's (NASDAQ:BCPC) Earnings Growth Rate Lags the 7.3% CAGR Delivered to Shareholders
Balchem Corporation (NASDAQ:BCPC) shareholders might be concerned after seeing the share price drop 10% in the last month. But at least the stock is up over the last five years. However we are not very impressed because the share price is only up 39%, less than the market return of 85%.
上個月股價下跌10%後,Balchem公司(納斯達克股票代碼:BCPC)的股東可能會感到擔憂。但至少該股在過去五年中有所上漲。但是,我們並沒有留下深刻的印象,因爲股價僅上漲了39%,低於85%的市場回報率。
Although Balchem has shed US$144m from its market cap this week, let's take a look at its longer term fundamental trends and see if they've driven returns.
儘管Balchem本週的市值下跌了1.44億美元,但讓我們來看看其長期基本面趨勢,看看它們是否推動了回報。
There is no denying that markets are sometimes efficient, but prices do not always reflect underlying business performance. One way to examine how market sentiment has changed over time is to look at the interaction between a company's share price and its earnings per share (EPS).
不可否認,市場有時是有效的,但價格並不總是能反映潛在的業務表現。研究市場情緒如何隨着時間的推移而變化的一種方法是研究公司股價與其每股收益(EPS)之間的相互作用。
During five years of share price growth, Balchem achieved compound earnings per share (EPS) growth of 6.6% per year. This EPS growth is remarkably close to the 7% average annual increase in the share price. That suggests that the market sentiment around the company hasn't changed much over that time. Rather, the share price has approximately tracked EPS growth.
在五年的股價增長中,Balchem實現了每年6.6%的複合每股收益(EPS)增長。每股收益的增長非常接近股價年均增長7%。這表明,在那段時間內,公司周圍的市場情緒沒有太大變化。相反,股價大致追蹤了每股收益的增長。
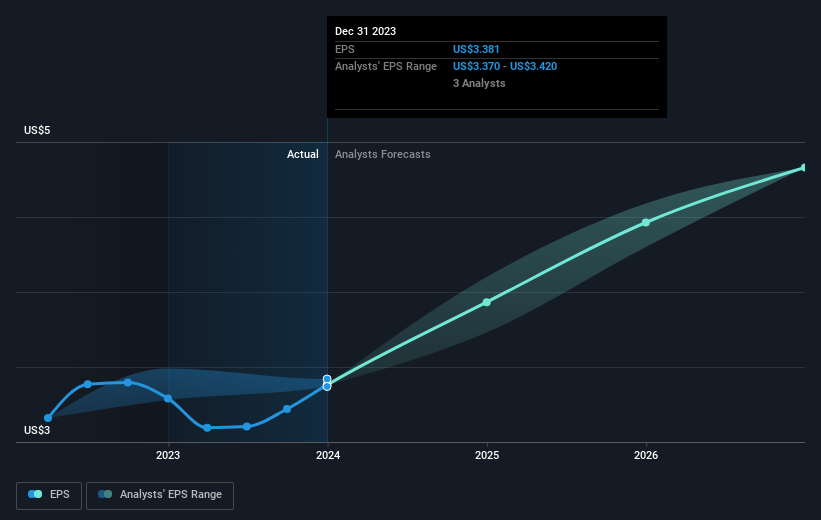
The image below shows how EPS has tracked over time (if you click on the image you can see greater detail).
下圖顯示了 EPS 在一段時間內的跟蹤情況(如果你點擊圖片,你可以看到更多細節)。
This free interactive report on Balchem's earnings, revenue and cash flow is a great place to start, if you want to investigate the stock further.
如果你想進一步調查該股,這份關於Balchem收益、收入和現金流的免費互動報告是一個很好的起點。
What About Dividends?
分紅呢?
As well as measuring the share price return, investors should also consider the total shareholder return (TSR). Whereas the share price return only reflects the change in the share price, the TSR includes the value of dividends (assuming they were reinvested) and the benefit of any discounted capital raising or spin-off. It's fair to say that the TSR gives a more complete picture for stocks that pay a dividend. In the case of Balchem, it has a TSR of 42% for the last 5 years. That exceeds its share price return that we previously mentioned. This is largely a result of its dividend payments!
除了衡量股價回報率外,投資者還應考慮股東總回報率(TSR)。儘管股價回報率僅反映股價的變化,但股東總回報率包括股息的價值(假設已進行再投資)以及任何折扣融資或分拆的收益。可以公平地說,股東總回報率爲支付股息的股票提供了更完整的畫面。就Balchem而言,在過去的5年中,其股東回報率爲42%。這超過了我們之前提到的其股價回報率。這在很大程度上是其股息支付的結果!
A Different Perspective
不同的視角
Balchem provided a TSR of 6.9% over the last twelve months. But that was short of the market average. If we look back over five years, the returns are even better, coming in at 7% per year for five years. Maybe the share price is just taking a breather while the business executes on its growth strategy. I find it very interesting to look at share price over the long term as a proxy for business performance. But to truly gain insight, we need to consider other information, too. Even so, be aware that Balchem is showing 1 warning sign in our investment analysis , you should know about...
在過去的十二個月中,Balchem的股東回報率爲6.9%。但這低於市場平均水平。如果我們回顧五年,回報率甚至更高,五年內每年爲7%。也許在企業執行增長戰略的同時,股價只是在稍作休息。我發現將長期股價視爲業務績效的代表非常有趣。但是,要真正獲得見解,我們還需要考慮其他信息。即便如此,請注意,Balchem在我們的投資分析中顯示了1個警告信號,您應該知道...
Of course, you might find a fantastic investment by looking elsewhere. So take a peek at this free list of companies we expect will grow earnings.
當然,通過尋找其他地方,你可能會找到一筆不錯的投資。因此,請看一下我們預計收益將增加的這份免費公司名單。
Please note, the market returns quoted in this article reflect the market weighted average returns of stocks that currently trade on American exchanges.
請注意,本文引用的市場回報反映了目前在美國交易所交易的股票的市場加權平均回報。
Have feedback on this article? Concerned about the content? Get in touch with us directly. Alternatively, email editorial-team (at) simplywallst.com.
This article by Simply Wall St is general in nature. We provide commentary based on historical data and analyst forecasts only using an unbiased methodology and our articles are not intended to be financial advice. It does not constitute a recommendation to buy or sell any stock, and does not take account of your objectives, or your financial situation. We aim to bring you long-term focused analysis driven by fundamental data. Note that our analysis may not factor in the latest price-sensitive company announcements or qualitative material. Simply Wall St has no position in any stocks mentioned.
對這篇文章有反饋嗎?對內容感到擔憂?直接聯繫我們。 或者,給編輯團隊 (at) simplywallst.com 發送電子郵件。
Simply Wall St的這篇文章本質上是籠統的。我們僅使用公正的方法根據歷史數據和分析師的預測提供評論,我們的文章無意作爲財務建議。它不構成買入或賣出任何股票的建議,也沒有考慮到您的目標或財務狀況。我們的目標是爲您提供由基本數據驅動的長期重點分析。請注意,我們的分析可能不考慮最新的價格敏感型公司公告或定性材料。簡而言之,華爾街沒有持有任何上述股票的頭寸。
譯文內容由第三人軟體翻譯。