
Investigating Mastercard's Standing In Financial Services Industry Compared To Competitors
Investigating Mastercard's Standing In Financial Services Industry Compared To Competitors
In today's rapidly evolving and fiercely competitive business landscape, it is crucial for investors and industry analysts to conduct comprehensive company evaluations. In this article, we will undertake an in-depth industry comparison, assessing Mastercard (NYSE:MA) alongside its primary competitors in the Financial Services industry. By meticulously examining crucial financial indicators, market positioning, and growth potential, we aim to provide valuable insights to investors and shed light on company's performance within the industry.
在當今瞬息萬變且競爭激烈的商業格局中,投資者和行業分析師進行全面的公司評估至關重要。在本文中,我們將進行深入的行業比較,評估 萬事達卡(紐約證券交易所代碼:MA) 以及其在金融服務行業的主要競爭對手。通過仔細研究關鍵財務指標、市場定位和增長潛力,我們的目標是爲投資者提供寶貴的見解,並闡明公司在行業內的表現。
Mastercard Background
萬事達背景
Mastercard is the second-largest payment processor in the world, having processed close to over $9 trillion in volume during 2023. Mastercard operates in over 200 countries and processes transactions in over 150 currencies.
萬事達卡是全球第二大支付處理商,2023年處理的交易量超過9萬億美元。萬事達卡在 200 多個國家開展業務,處理超過 150 種貨幣的交易。
| Company | P/E | P/B | P/S | ROE | EBITDA (in billions) | Gross Profit (in billions) | Revenue Growth |
|---|---|---|---|---|---|---|---|
| Mastercard Inc | 39.09 | 62.26 | 17.43 | 42.16% | $3.67 | $5.02 | 12.57% |
| Visa Inc | 30.71 | 14.22 | 16.54 | 11.86% | $5.84 | $6.98 | 9.89% |
| Fiserv Inc | 29.25 | 3.17 | 4.87 | 2.51% | $1.96 | $2.88 | 7.39% |
| PayPal Holdings Inc | 17.18 | 3.30 | 2.45 | 6.87% | $2.14 | $3.67 | 8.71% |
| Block Inc | 3724 | 2.45 | 2.09 | 0.98% | $0.15 | $2.03 | 24.13% |
| Fidelity National Information Services Inc | 81.88 | 2.10 | 4.19 | 1.3% | $0.66 | $0.97 | -0.59% |
| Global Payments Inc | 33.04 | 1.38 | 3.38 | 1.59% | $0.99 | $1.51 | 8.03% |
| Corpay Inc | 23.02 | 6.65 | 6.01 | 8.07% | $0.51 | $0.74 | 6.08% |
| Jack Henry & Associates Inc | 32.27 | 6.97 | 5.57 | 5.43% | $0.17 | $0.22 | 7.99% |
| WEX Inc | 35.22 | 5.10 | 3.60 | 3.66% | $0.23 | $0.39 | 6.65% |
| StoneCo Ltd | 17.76 | 1.78 | 2.36 | 4.53% | $1.13 | $2.3 | 20.35% |
| Euronet Worldwide Inc | 18.88 | 3.81 | 1.45 | 5.79% | $0.15 | $0.36 | 10.63% |
| The Western Union Co | 7.97 | 11.45 | 1.12 | 32.55% | $0.24 | $0.41 | 1.18% |
| PagSeguro Digital Ltd | 12.79 | 1.63 | 2.34 | 3.74% | $1.79 | $0.2 | 7.56% |
| DLocal Ltd | 29.31 | 9.11 | 6.69 | 6.44% | $-0.02 | $0.07 | 58.75% |
| Shift4 Payments Inc | 41.31 | 5.64 | 1.40 | 2.6% | $0.09 | $0.2 | 31.19% |
| Paymentus Holdings Inc | 115.44 | 6 | 4.23 | 2.22% | $0.02 | $0.05 | 24.68% |
| Evertec Inc | 31.76 | 4.17 | 3.64 | 2.04% | $0.06 | $0.1 | 20.29% |
| Payoneer Global Inc | 20.88 | 2.81 | 2.37 | 4.15% | $0.03 | $0.19 | 22.21% |
| Average | 239.04 | 5.1 | 4.13 | 5.91% | $0.9 | $1.29 | 15.28% |
| 公司 | P/E | P/B | 市銷率 | 羅伊 | 息稅折舊攤銷前利潤(單位:十億) | 毛利(單位:十億) | 收入增長 |
|---|---|---|---|---|---|---|---|
| 萬事達卡公司 | 39.09 | 62.26 | 17.43 | 42.16% | 3.67 | 5.02 美元 | 12.57% |
| Visa Inc | 30.71 | 14.22 | 16.54 | 11.86% | 5.84 美元 | 6.98 美元 | 9.89% |
| Fiserv Inc. | 29.25 | 3.17 | 4.87 | 2.51% | 1.96 美元 | 2.88 美元 | 7.39% |
| 貝寶控股公司 | 17.18 | 3.30 | 2.45 | 6.87% | 2.14 美元 | 3.67 | 8.71% |
| Block Inc | 3724 | 2.45 | 2.09 | 0.98% | 0.15 美元 | 2.03 美元 | 24.13% |
| 富達國家信息服務公司 | 81.88 | 2.10 | 4.19 | 1.3% | 0.66 美元 | 0.97 美元 | -0.59% |
| 全球支付公司 | 33.04 | 1.38 | 3.38 | 1.59% | 0.99 美元 | 1.51 | 8.03% |
| Corpay Inc | 23.02 | 6.65 | 6.01 | 8.07% | 0.51 美元 | 0.74 美元 | 6.08% |
| 傑克·亨利律師事務所 | 32.27 | 6.97 | 5.57 | 5.43% | 0.17 美元 | 0.22 美元 | 7.99% |
| WEX Inc | 35.22 | 5.10 | 3.60 | 3.66% | 0.23 美元 | 0.39 美元 | 6.65% |
| Stoneco Ltd | 17.76 | 1.78 | 2.36 | 4.53% | 1.13 | 2.3 美元 | 20.35% |
| Euronet 全球公司 | 18.88 | 3.81 | 1.45 | 5.79% | 0.15 美元 | 0.36 美元 | 10.63% |
| 西聯匯款公司 | 7.97 | 11.45 | 1.12 | 32.55% | 0.24 美元 | 0.41 美元 | 1.18% |
| PagSeguro 數字有限公司 | 12.79 | 1.63 | 2.34 | 3.74% | 1.79 美元 | 0.2 美元 | 7.56% |
| dLocal 有限公司 | 29.31 | 9.11 | 6.69 | 6.44% | -0.02 美元 | 0.07 美元 | 58.75% |
| Shift4 Payments | 41.31 | 5.64 | 1.40 | 2.6% | 0.09 | 0.2 美元 | 31.19% |
| Paymentus 控股公司 | 115.44 | 6 | 4.23 | 2.22% | 0.02 | 0.05 美元 | 24.68% |
| 埃弗泰克公司 | 31.76 | 4.17 | 3.64 | 2.04% | 0.06 美元 | 0.1 美元 | 20.29% |
| Payoneer Global Inc | 20.88 | 2.81 | 2.37 | 4.15% | 0.03 美元 | 0.19 美元 | 22.21% |
| 平均值 | 239.04 | 5.1 | 4.13 | 5.91% | 0.9 美元 | 1.29 美元 | 15.28% |
By thoroughly analyzing Mastercard, we can discern the following trends:
通過深入分析萬事達卡,我們可以辨別出以下趨勢:
The Price to Earnings ratio of 39.09 is 0.16x lower than the industry average, indicating potential undervaluation for the stock.
The elevated Price to Book ratio of 62.26 relative to the industry average by 12.21x suggests company might be overvalued based on its book value.
The Price to Sales ratio of 17.43, which is 4.22x the industry average, suggests the stock could potentially be overvalued in relation to its sales performance compared to its peers.
The Return on Equity (ROE) of 42.16% is 36.25% above the industry average, highlighting efficient use of equity to generate profits.
The company has higher Earnings Before Interest, Taxes, Depreciation, and Amortization (EBITDA) of $3.67 Billion, which is 4.08x above the industry average, indicating stronger profitability and robust cash flow generation.
With higher gross profit of $5.02 Billion, which indicates 3.89x above the industry average, the company demonstrates stronger profitability and higher earnings from its core operations.
The company is witnessing a substantial decline in revenue growth, with a rate of 12.57% compared to the industry average of 15.28%, which indicates a challenging sales environment.
的市盈率 39.09 是 0.16 倍 低於行業平均水平,表明該股的估值可能被低估。
價格與賬面比率的上升 62.26 相對於行業平均水平 12.21x 表明根據賬面價值,公司的估值可能被高估了。
的價格與銷售的比率 17.43,這是 4.22x 行業平均水平表明,與同行相比,該股的銷售表現可能被高估了。
的股本回報率 (ROE) 42.16% 是 36.25% 高於行業平均水平,突顯了有效利用股權來創造利潤。
該公司的扣除利息、稅項、折舊和攤銷前的收益 (EBITDA) 較高 3.67 億美元,這是 4.08 倍 高於行業平均水平,表明盈利能力更強,現金流產生強勁。
毛利更高 5.02 億美元,這表明 3.89 倍 高於行業平均水平,該公司表現出更強的盈利能力和更高的核心業務收益。
該公司的收入增長大幅下降,增長率爲 12.57% 與行業平均水平相比 15.28%,這表明銷售環境充滿挑戰。
Debt To Equity Ratio
負債權益比率
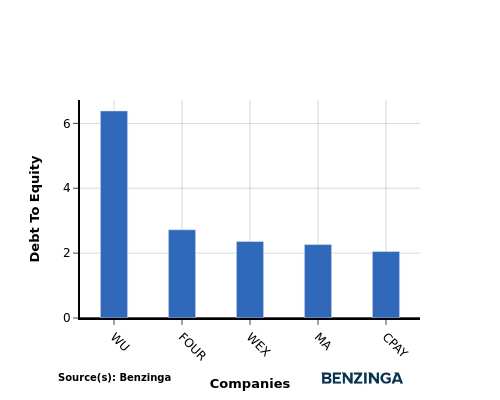
The debt-to-equity (D/E) ratio assesses the extent to which a company relies on borrowed funds compared to its equity.
債務與權益(D/E)比率評估了公司對借入資金的依賴程度與其權益相比的程度。
Considering the debt-to-equity ratio in industry comparisons allows for a concise evaluation of a company's financial health and risk profile, aiding in informed decision-making.
在行業比較中考慮債務與權益比率可以對公司的財務狀況和風險狀況進行簡明的評估,從而有助於做出明智的決策。
By evaluating Mastercard against its top 4 peers in terms of the Debt-to-Equity ratio, the following observations arise:
通過評估萬事達卡在債務與權益比率方面與排名前四的同行,得出以下觀察結果:
Mastercard is positioned in the middle in terms of the debt-to-equity ratio compared to its top 4 peers.
This suggests a balanced financial structure, where the company maintains a moderate level of debt while also relying on equity financing with a debt-to-equity ratio of 2.26.
與前四名同行相比,萬事達卡在債務與權益比率方面處於中間位置。
這表明財務結構平衡,公司保持適度的債務水平,同時也依賴股權融資,債務與權益比率爲 2.26。
Key Takeaways
關鍵要點
For Mastercard, the PE ratio is low compared to peers, indicating potential undervaluation. The high PB and PS ratios suggest strong market sentiment and revenue multiples. Mastercard's high ROE, EBITDA, and gross profit reflect efficient operations and profitability. However, the low revenue growth may indicate a need for strategic initiatives to drive future performance in the Financial Services industry.
對於萬事達卡而言,與同行相比,市盈率較低,這表明估值可能被低估。較高的市盈率和市盈率表明強勁的市場情緒和收入倍數。萬事達卡的高投資回報率、息稅折舊攤銷前利潤和毛利潤反映了高效的運營和盈利能力。但是,低收入增長可能表明需要採取戰略舉措來推動金融服務行業的未來表現。
This article was generated by Benzinga's automated content engine and reviewed by an editor.
本文由Benzinga的自動內容引擎生成,並由編輯審閱。
譯文內容由第三人軟體翻譯。