
 Yahoo Finance
 When Can We Expect A Profit From Akebia Therapeutics, Inc. (NASDAQ:AKBA)?
With the business potentially at an important milestone, we thought we'd take a closer look at Akebia Therapeutics, Inc.'s (NASDAQ:AKBA) future prospects. Akebia Therapeutics, Inc., a biopharmaceutical company, focuses on the development and commercialization of therapeutics for patients with kidney diseases. On 31 December 2023, the US$281m market-cap company posted a loss of US$52m for its most recent financial year. As path to profitability is the topic on Akebia Therapeutics' investors mind, we've decided to gauge market sentiment. In this article, we will touch on the expectations for the company's growth and when analysts expect it to become profitable.
See our latest analysis for Akebia Therapeutics
Akebia Therapeutics is bordering on breakeven, according to the 3 American Biotechs analysts. They expect the company to post a final loss in 2025, before turning a profit of US$38m in 2026. Therefore, the company is expected to breakeven roughly 2 years from today. What rate will the company have to grow year-on-year in order to breakeven on this date? Using a line of best fit, we calculated an average annual growth rate of 60%, which signals high confidence from analysts. If this rate turns out to be too aggressive, the company may become profitable much later than analysts predict.
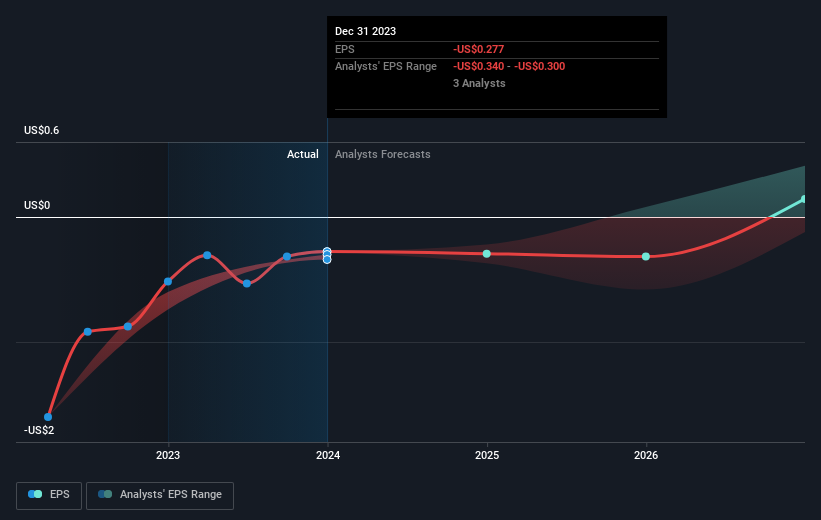
We're not going to go through company-specific developments for Akebia Therapeutics given that this is a high-level summary, though, bear in mind that generally biotechs, depending on the stage of product development, have irregular periods of cash flow. So, a high growth rate is not out of the ordinary, particularly when a company is in a period of investment.
Before we wrap up, there’s one issue worth mentioning. Akebia Therapeutics currently has negative equity on its balance sheet. Accounting methods used to deal with losses accumulated over time can cause this to occur. This is because liabilities are carried forward into the future until it cancels. Oftentimes, losses exist only on paper but other times, it can be a red flag.
Next Steps:
There are too many aspects of Akebia Therapeutics to cover in one brief article, but the key fundamentals for the company can all be found in one place – Akebia Therapeutics' company page on Simply Wall St. We've also compiled a list of key factors you should look at:
Historical Track Record: What has Akebia Therapeutics' performance been like over the past? Go into more detail in the past track record analysis and take a look at the free visual representations of our analysis for more clarity.
Management Team: An experienced management team on the helm increases our confidence in the business – take a look at who sits on Akebia Therapeutics' board and the CEO’s background.
Other High-Performing Stocks: Are there other stocks that provide better prospects with proven track records? Explore our free list of these great stocks here.
Have feedback on this article? Concerned about the content? Get in touch with us directly. Alternatively, email editorial-team (at) simplywallst.com.
This article by Simply Wall St is general in nature. We provide commentary based on historical data and analyst forecasts only using an unbiased methodology and our articles are not intended to be financial advice. It does not constitute a recommendation to buy or sell any stock, and does not take account of your objectives, or your financial situation. We aim to bring you long-term focused analysis driven by fundamental data. Note that our analysis may not factor in the latest price-sensitive company announcements or qualitative material. Simply Wall St has no position in any stocks mentioned.
