
 Yahoo Finance
 Simulations Plus' (NASDAQ:SLP) Returns On Capital Not Reflecting Well On The Business
If we want to find a stock that could multiply over the long term, what are the underlying trends we should look for? Firstly, we'd want to identify a growing return on capital employed (ROCE) and then alongside that, an ever-increasing base of capital employed. Ultimately, this demonstrates that it's a business that is reinvesting profits at increasing rates of return. In light of that, when we looked at Simulations Plus (NASDAQ:SLP) and its ROCE trend, we weren't exactly thrilled.
Return On Capital Employed (ROCE): What Is It?
If you haven't worked with ROCE before, it measures the 'return' (pre-tax profit) a company generates from capital employed in its business. To calculate this metric for Simulations Plus, this is the formula:
Return on Capital Employed = Earnings Before Interest and Tax (EBIT) ÷ (Total Assets - Current Liabilities)
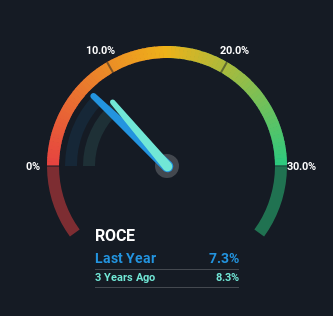
0.073 = US$13m ÷ (US$194m - US$15m) (Based on the trailing twelve months to February 2024).
So, Simulations Plus has an ROCE of 7.3%. On its own, that's a low figure but it's around the 6.1% average generated by the Healthcare Services industry.
View our latest analysis for Simulations Plus
Above you can see how the current ROCE for Simulations Plus compares to its prior returns on capital, but there's only so much you can tell from the past. If you'd like to see what analysts are forecasting going forward, you should check out our free analyst report for Simulations Plus .
So How Is Simulations Plus' ROCE Trending?
In terms of Simulations Plus' historical ROCE movements, the trend isn't fantastic. Over the last five years, returns on capital have decreased to 7.3% from 27% five years ago. However, given capital employed and revenue have both increased it appears that the business is currently pursuing growth, at the consequence of short term returns. And if the increased capital generates additional returns, the business, and thus shareholders, will benefit in the long run.
What We Can Learn From Simulations Plus' ROCE
Even though returns on capital have fallen in the short term, we find it promising that revenue and capital employed have both increased for Simulations Plus. Furthermore the stock has climbed 98% over the last five years, it would appear that investors are upbeat about the future. So should these growth trends continue, we'd be optimistic on the stock going forward.
On a separate note, we've found 1 warning sign for Simulations Plus you'll probably want to know about.
While Simulations Plus may not currently earn the highest returns, we've compiled a list of companies that currently earn more than 25% return on equity. Check out this free list here.
Have feedback on this article? Concerned about the content? Get in touch with us directly. Alternatively, email editorial-team (at) simplywallst.com.
This article by Simply Wall St is general in nature. We provide commentary based on historical data and analyst forecasts only using an unbiased methodology and our articles are not intended to be financial advice. It does not constitute a recommendation to buy or sell any stock, and does not take account of your objectives, or your financial situation. We aim to bring you long-term focused analysis driven by fundamental data. Note that our analysis may not factor in the latest price-sensitive company announcements or qualitative material. Simply Wall St has no position in any stocks mentioned.
