
Calculating The Fair Value Of Lululemon Athletica Inc. (NASDAQ:LULU)
Calculating The Fair Value Of Lululemon Athletica Inc. (NASDAQ:LULU)
Key Insights
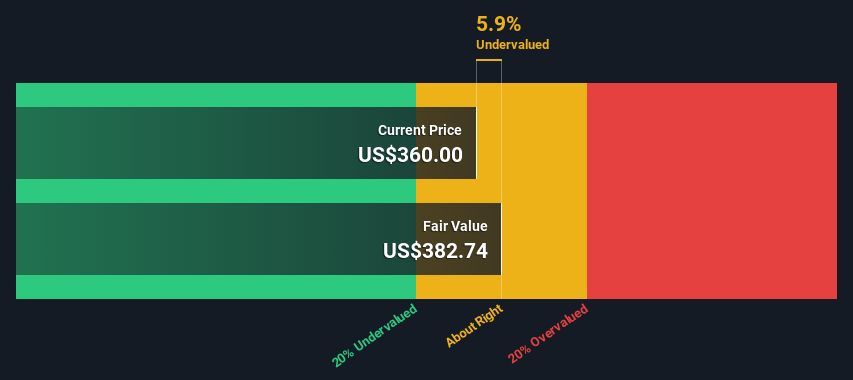
Using the 2 Stage Free Cash Flow to Equity, Lululemon Athletica fair value estimate is US$383
Lululemon Athletica's US$360 share price indicates it is trading at similar levels as its fair value estimate
The US$466 analyst price target for LULU is 22% more than our estimate of fair value
Today we will run through one way of estimating the intrinsic value of Lululemon Athletica Inc. (NASDAQ:LULU) by estimating the company's future cash flows and discounting them to their present value. We will take advantage of the Discounted Cash Flow (DCF) model for this purpose. Don't get put off by the jargon, the math behind it is actually quite straightforward.
We would caution that there are many ways of valuing a company and, like the DCF, each technique has advantages and disadvantages in certain scenarios. Anyone interested in learning a bit more about intrinsic value should have a read of the Simply Wall St analysis model.
The Calculation
We're using the 2-stage growth model, which simply means we take in account two stages of company's growth. In the initial period the company may have a higher growth rate and the second stage is usually assumed to have a stable growth rate. In the first stage we need to estimate the cash flows to the business over the next ten years. Where possible we use analyst estimates, but when these aren't available we extrapolate the previous free cash flow (FCF) from the last estimate or reported value. We assume companies with shrinking free cash flow will slow their rate of shrinkage, and that companies with growing free cash flow will see their growth rate slow, over this period. We do this to reflect that growth tends to slow more in the early years than it does in later years.
Generally we assume that a dollar today is more valuable than a dollar in the future, and so the sum of these future cash flows is then discounted to today's value:
10-year free cash flow (FCF) estimate
2024 | 2025 | 2026 | 2027 | 2028 | 2029 | 2030 | 2031 | 2032 | 2033 | |
Levered FCF ($, Millions) | US$1.28b | US$1.39b | US$1.56b | US$1.70b | US$2.01b | US$2.47b | US$2.75b | US$3.00b | US$3.20b | US$3.38b |
Growth Rate Estimate Source | Analyst x12 | Analyst x13 | Analyst x13 | Analyst x5 | Analyst x2 | Analyst x1 | Est @ 11.65% | Est @ 8.84% | Est @ 6.88% | Est @ 5.50% |
Present Value ($, Millions) Discounted @ 7.4% | US$1.2k | US$1.2k | US$1.3k | US$1.3k | US$1.4k | US$1.6k | US$1.7k | US$1.7k | US$1.7k | US$1.7k |
("Est" = FCF growth rate estimated by Simply Wall St)
Present Value of 10-year Cash Flow (PVCF) = US$15b
After calculating the present value of future cash flows in the initial 10-year period, we need to calculate the Terminal Value, which accounts for all future cash flows beyond the first stage. For a number of reasons a very conservative growth rate is used that cannot exceed that of a country's GDP growth. In this case we have used the 5-year average of the 10-year government bond yield (2.3%) to estimate future growth. In the same way as with the 10-year 'growth' period, we discount future cash flows to today's value, using a cost of equity of 7.4%.
Terminal Value (TV)= FCF2033 × (1 + g) ÷ (r – g) = US$3.4b× (1 + 2.3%) ÷ (7.4%– 2.3%) = US$68b
Present Value of Terminal Value (PVTV)= TV / (1 + r)10= US$68b÷ ( 1 + 7.4%)10= US$34b
The total value is the sum of cash flows for the next ten years plus the discounted terminal value, which results in the Total Equity Value, which in this case is US$48b. The last step is to then divide the equity value by the number of shares outstanding. Compared to the current share price of US$360, the company appears about fair value at a 5.9% discount to where the stock price trades currently. Valuations are imprecise instruments though, rather like a telescope - move a few degrees and end up in a different galaxy. Do keep this in mind.
NasdaqGS:LULU Discounted Cash Flow April 26th 2024
Important Assumptions
Now the most important inputs to a discounted cash flow are the discount rate, and of course, the actual cash flows. If you don't agree with these result, have a go at the calculation yourself and play with the assumptions. The DCF also does not consider the possible cyclicality of an industry, or a company's future capital requirements, so it does not give a full picture of a company's potential performance. Given that we are looking at Lululemon Athletica as potential shareholders, the cost of equity is used as the discount rate, rather than the cost of capital (or weighted average cost of capital, WACC) which accounts for debt. In this calculation we've used 7.4%, which is based on a levered beta of 1.101. Beta is a measure of a stock's volatility, compared to the market as a whole. We get our beta from the industry average beta of globally comparable companies, with an imposed limit between 0.8 and 2.0, which is a reasonable range for a stable business.
SWOT Analysis for Lululemon Athletica
Strength
Earnings growth over the past year exceeded the industry.
Currently debt free.
Balance sheet summary for LULU.
Weakness
No major weaknesses identified for LULU.
Opportunity
Annual revenue is forecast to grow faster than the American market.
Current share price is below our estimate of fair value.
Significant insider buying over the past 3 months.
Threat
Annual earnings are forecast to grow slower than the American market.
What else are analysts forecasting for LULU?
Looking Ahead:
Whilst important, the DCF calculation ideally won't be the sole piece of analysis you scrutinize for a company. It's not possible to obtain a foolproof valuation with a DCF model. Instead the best use for a DCF model is to test certain assumptions and theories to see if they would lead to the company being undervalued or overvalued. For example, changes in the company's cost of equity or the risk free rate can significantly impact the valuation. For Lululemon Athletica, we've compiled three important aspects you should further research:
Financial Health: Does LULU have a healthy balance sheet? Take a look at our free balance sheet analysis with six simple checks on key factors like leverage and risk.
Future Earnings: How does LULU's growth rate compare to its peers and the wider market? Dig deeper into the analyst consensus number for the upcoming years by interacting with our free analyst growth expectation chart.
Other Solid Businesses: Low debt, high returns on equity and good past performance are fundamental to a strong business. Why not explore our interactive list of stocks with solid business fundamentals to see if there are other companies you may not have considered!
PS. The Simply Wall St app conducts a discounted cash flow valuation for every stock on the NASDAQGS every day. If you want to find the calculation for other stocks just search here.
關鍵見解
使用兩階段的股本自由現金流,Lululemon Athletica的公允價值估計爲383美元
Lululemon Athletica的360美元股價表明其交易價格與其公允價值估計相似
分析師對露露的466美元目標股價比我們對公允價值的估計高出22%
今天,我們將介紹一種估算Lululemon Athletica Inc.(納斯達克股票代碼:LULU)內在價值的方法,即估算公司未來的現金流並將其折現爲現值。爲此,我們將利用折扣現金流 (DCF) 模型。不要被行話嚇跑,它背後的數學其實很簡單。
我們要提醒的是,對公司進行估值的方法有很多,就像DCF一樣,每種技術在某些情況下都有優點和缺點。任何有興趣進一步了解內在價值的人都應該讀一讀 Simply Wall St 分析模型。
計算結果
我們使用的是兩階段增長模型,這只是意味着我們考慮了公司增長的兩個階段。在初始階段,公司的增長率可能更高,而第二階段通常被認爲具有穩定的增長率。在第一階段,我們需要估算未來十年的業務現金流。在可能的情況下,我們會使用分析師的估計值,但是當這些估計值不可用時,我們會從最新的估計值或報告的價值中推斷出之前的自由現金流(FCF)。我們假設自由現金流萎縮的公司將減緩其萎縮速度,而自由現金流不斷增長的公司在此期間的增長率將放緩。我們這樣做是爲了反映早期增長的放緩幅度往往比後來的幾年更大。
通常,我們假設今天的一美元比未來一美元更有價值,因此這些未來現金流的總和將折現爲今天的價值:
10 年自由現金流 (FCF) 估計
2024 | 2025 | 2026 | 2027 | 2028 | 2029 | 2030 | 2031 | 2032 | 2033 | |
Levered FCF(美元,百萬) | 12.8 億美元 | 13.9 億美元 | 15.6 億美元 | 17.0 億美元 | 201 億美元 | 24.7 億美元 | 27.5 億美元 | 300 億美元 | 320 億美元 | 33.8 億美元 |
增長率估算來源 | 分析師 x12 | 分析師 x13 | 分析師 x13 | 分析師 x5 | 分析師 x2 | 分析師 x1 | 美國東部標準時間 @ 11.65% | Est @ 8.84% | Est @ 6.88% | 東部時間 @ 5.50% |
現值(美元,百萬)折扣 @ 7.4% | 120 萬美元 | 120 萬美元 | 130 萬美元 | 130 萬美元 | 140 萬美元 | 160 萬美元 | 17k 美元 | 17k 美元 | 17k 美元 | 17k 美元 |
(“Est” = Simply Wall St估計的FCF增長率)
10 年期現金流 (PVCF) 的現值 = 150 億美元
在計算了最初10年期內未來現金流的現值之後,我們需要計算終值,該終值涵蓋了第一階段以後的所有未來現金流。出於多種原因,使用的增長率非常保守,不能超過一個國家的GDP增長率。在這種情況下,我們使用10年期國債收益率的5年平均值(2.3%)來估計未來的增長。與10年 “增長” 期一樣,我們使用7.4%的股本成本將未來的現金流折現爲今天的價值。
終端價值 (TV) = FCF2033 × (1 + g) ÷ (r — g) = 34億美元× (1 + 2.3%) ÷ (7.4% — 2.3%) = 680億美元
終端價值的現值 (PVTV) = 電視/ (1 + r)10= 680億美元÷ (1 + 7.4%)10= 340億美元
總價值是未來十年的現金流總額加上貼現的終端價值,由此得出總權益價值,在本例中爲480億美元。最後一步是將股票價值除以已發行股票的數量。與目前的360美元股價相比,該公司的公允價值似乎比目前的股價折扣了5.9%。但是,估值是不精確的工具,就像望遠鏡一樣——移動幾度,最終進入另一個星系。請記住這一點。
納斯達克GS:露露貼現現金流 2024 年 4 月 26 日
重要假設
現在,貼現現金流的最重要輸入是貼現率,當然還有實際現金流。如果你不同意這些結果,那就自己計算一下,試一試假設。DCF也沒有考慮一個行業可能的週期性,也沒有考慮公司未來的資本需求,因此它沒有全面反映公司的潛在表現。鑑於我們將Lululemon Athletica視爲潛在股東,因此使用權益成本作爲貼現率,而不是構成債務的資本成本(或加權平均資本成本,WACC)。在此計算中,我們使用了7.4%,這是基於1.101的槓桿測試版。Beta是衡量股票與整個市場相比波動性的指標。我們的測試版來自全球可比公司的行業平均貝塔值,設定在0.8到2.0之間,這是一個穩定的業務的合理範圍。
Lululemon Athletica 的 SWOT 分析
力量
過去一年的收益增長超過了該行業。
目前無債務。
露露的資產負債表摘要。
弱點
沒有發現露露的主要弱點。
機會
預計年收入的增長速度將快於美國市場。
目前的股價低於我們對公允價值的估計。
在過去的3個月中進行了大量的內幕收購。
威脅
預計年收益的增長速度將低於美國市場。
分析師對露露還有什麼預測?
展望未來:
雖然重要,但理想情況下,DCF的計算不會是您爲公司仔細檢查的唯一分析內容。使用DCF模型不可能獲得萬無一失的估值。取而代之的是,DCF模型的最佳用途是測試某些假設和理論,看看它們是否會導致公司被低估或高估。例如,公司權益成本或無風險利率的變化會對估值產生重大影響。對於Lululemon Athletica,我們整理了三個重要方面,你應該進一步研究:
財務狀況:露露的資產負債表健康嗎?看看我們的免費資產負債表分析,其中包含對槓桿和風險等關鍵因素的六項簡單檢查。
未來收益:與同行和整個市場相比,露露的增長率如何?通過與我們的免費分析師增長預期圖表互動,深入了解未來幾年的分析師共識數字。
其他穩健的業務:低債務、高股本回報率和良好的過去表現是強大業務的基礎。爲什麼不瀏覽我們具有堅實業務基礎的股票互動清單,看看是否還有其他你可能沒有考慮過的公司!
PS。Simply Wall St應用程序每天對納斯達克證券交易所的每隻股票進行折扣現金流估值。如果您想找到其他股票的計算方法,請在此處搜索。
譯文內容由第三人軟體翻譯。
風險及免責聲明
- 分享到weixin
- 分享到qq
- 分享到facebook
- 分享到twitter
- 分享到微博
- 粘贴板
使用瀏覽器的分享功能,分享給你的好友吧