
Estimating The Intrinsic Value Of Cloudflare, Inc. (NYSE:NET)
Estimating The Intrinsic Value Of Cloudflare, Inc. (NYSE:NET)
Key Insights
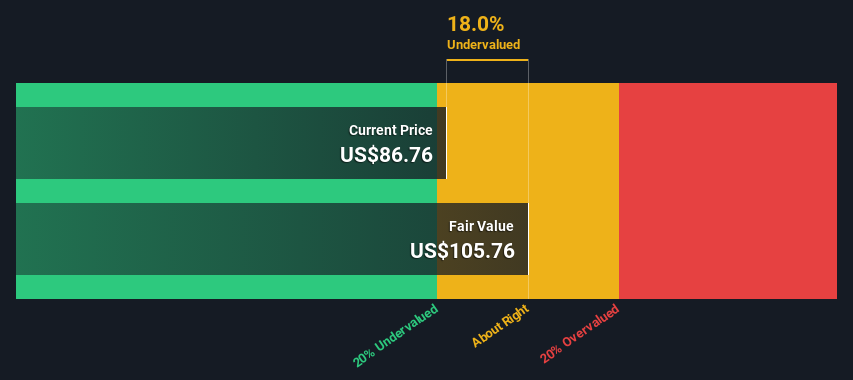
- Using the 2 Stage Free Cash Flow to Equity, Cloudflare fair value estimate is US$106
- Current share price of US$86.76 suggests Cloudflare is potentially trading close to its fair value
- Analyst price target for NET is US$101 which is 4.5% below our fair value estimate
How far off is Cloudflare, Inc. (NYSE:NET) from its intrinsic value? Using the most recent financial data, we'll take a look at whether the stock is fairly priced by taking the expected future cash flows and discounting them to their present value. We will use the Discounted Cash Flow (DCF) model on this occasion. Models like these may appear beyond the comprehension of a lay person, but they're fairly easy to follow.
We generally believe that a company's value is the present value of all of the cash it will generate in the future. However, a DCF is just one valuation metric among many, and it is not without flaws. Anyone interested in learning a bit more about intrinsic value should have a read of the Simply Wall St analysis model.
The Calculation
We are going to use a two-stage DCF model, which, as the name states, takes into account two stages of growth. The first stage is generally a higher growth period which levels off heading towards the terminal value, captured in the second 'steady growth' period. To start off with, we need to estimate the next ten years of cash flows. Where possible we use analyst estimates, but when these aren't available we extrapolate the previous free cash flow (FCF) from the last estimate or reported value. We assume companies with shrinking free cash flow will slow their rate of shrinkage, and that companies with growing free cash flow will see their growth rate slow, over this period. We do this to reflect that growth tends to slow more in the early years than it does in later years.
A DCF is all about the idea that a dollar in the future is less valuable than a dollar today, and so the sum of these future cash flows is then discounted to today's value:
10-year free cash flow (FCF) forecast
| 2024 | 2025 | 2026 | 2027 | 2028 | 2029 | 2030 | 2031 | 2032 | 2033 | |
| Levered FCF ($, Millions) | US$164.6m | US$228.5m | US$504.1m | US$745.6m | US$1.20b | US$1.58b | US$1.93b | US$2.24b | US$2.52b | US$2.75b |
| Growth Rate Estimate Source | Analyst x18 | Analyst x18 | Analyst x6 | Analyst x4 | Analyst x3 | Est @ 30.94% | Est @ 22.34% | Est @ 16.33% | Est @ 12.12% | Est @ 9.17% |
| Present Value ($, Millions) Discounted @ 7.3% | US$153 | US$198 | US$408 | US$562 | US$846 | US$1.0k | US$1.2k | US$1.3k | US$1.3k | US$1.4k |
("Est" = FCF growth rate estimated by Simply Wall St)
Present Value of 10-year Cash Flow (PVCF) = US$8.3b
The second stage is also known as Terminal Value, this is the business's cash flow after the first stage. The Gordon Growth formula is used to calculate Terminal Value at a future annual growth rate equal to the 5-year average of the 10-year government bond yield of 2.3%. We discount the terminal cash flows to today's value at a cost of equity of 7.3%.
Terminal Value (TV)= FCF2033 × (1 + g) ÷ (r – g) = US$2.7b× (1 + 2.3%) ÷ (7.3%– 2.3%) = US$56b
Present Value of Terminal Value (PVTV)= TV / (1 + r)10= US$56b÷ ( 1 + 7.3%)10= US$28b
The total value is the sum of cash flows for the next ten years plus the discounted terminal value, which results in the Total Equity Value, which in this case is US$36b. To get the intrinsic value per share, we divide this by the total number of shares outstanding. Compared to the current share price of US$86.8, the company appears about fair value at a 18% discount to where the stock price trades currently. Valuations are imprecise instruments though, rather like a telescope - move a few degrees and end up in a different galaxy. Do keep this in mind.
The Assumptions
Now the most important inputs to a discounted cash flow are the discount rate, and of course, the actual cash flows. You don't have to agree with these inputs, I recommend redoing the calculations yourself and playing with them. The DCF also does not consider the possible cyclicality of an industry, or a company's future capital requirements, so it does not give a full picture of a company's potential performance. Given that we are looking at Cloudflare as potential shareholders, the cost of equity is used as the discount rate, rather than the cost of capital (or weighted average cost of capital, WACC) which accounts for debt. In this calculation we've used 7.3%, which is based on a levered beta of 1.093. Beta is a measure of a stock's volatility, compared to the market as a whole. We get our beta from the industry average beta of globally comparable companies, with an imposed limit between 0.8 and 2.0, which is a reasonable range for a stable business.
SWOT Analysis for Cloudflare
- Cash in surplus of total debt.
- Balance sheet summary for NET.
- Shareholders have been diluted in the past year.
- Forecast to reduce losses next year.
- Has sufficient cash runway for more than 3 years based on current free cash flows.
- Current share price is below our estimate of fair value.
- Debt is not well covered by operating cash flow.
- Not expected to become profitable over the next 3 years.
- Is NET well equipped to handle threats?
Moving On:
Valuation is only one side of the coin in terms of building your investment thesis, and it ideally won't be the sole piece of analysis you scrutinize for a company. The DCF model is not a perfect stock valuation tool. Instead the best use for a DCF model is to test certain assumptions and theories to see if they would lead to the company being undervalued or overvalued. For example, changes in the company's cost of equity or the risk free rate can significantly impact the valuation. For Cloudflare, we've compiled three relevant items you should consider:
- Risks: We feel that you should assess the 3 warning signs for Cloudflare we've flagged before making an investment in the company.
- Future Earnings: How does NET's growth rate compare to its peers and the wider market? Dig deeper into the analyst consensus number for the upcoming years by interacting with our free analyst growth expectation chart.
- Other High Quality Alternatives: Do you like a good all-rounder? Explore our interactive list of high quality stocks to get an idea of what else is out there you may be missing!
PS. Simply Wall St updates its DCF calculation for every American stock every day, so if you want to find the intrinsic value of any other stock just search here.
Have feedback on this article? Concerned about the content? Get in touch with us directly. Alternatively, email editorial-team (at) simplywallst.com.
This article by Simply Wall St is general in nature. We provide commentary based on historical data and analyst forecasts only using an unbiased methodology and our articles are not intended to be financial advice. It does not constitute a recommendation to buy or sell any stock, and does not take account of your objectives, or your financial situation. We aim to bring you long-term focused analysis driven by fundamental data. Note that our analysis may not factor in the latest price-sensitive company announcements or qualitative material. Simply Wall St has no position in any stocks mentioned.
關鍵見解
- 使用兩階段的自由現金流股權,Cloudflare的公允價值估計爲106美元
- 目前的股價爲86.76美元,表明Cloudflare的交易價格可能接近其公允價值
- 分析師淨股價目標爲101美元,比我們的公允價值估計低4.5%
Cloudflare, Inc.(紐約證券交易所代碼:NET)距離其內在價值有多遠?我們將使用最新的財務數據,通過計算預期的未來現金流並將其折現爲現值,來研究股票的定價是否合理。在這種情況下,我們將使用折扣現金流(DCF)模型。像這樣的模型可能看起來超出外行人的理解,但它們很容易理解。
我們普遍認爲,公司的價值是其未來將產生的所有現金的現值。但是,差價合約只是衆多估值指標中的一個,而且並非沒有缺陷。任何有興趣進一步了解內在價值的人都應該讀一讀 Simply Wall St 分析模型。
計算結果
我們將使用兩階段的DCF模型,顧名思義,該模型考慮了兩個增長階段。第一階段通常是較高的增長期,在第二個 “穩步增長” 時期逐漸趨於平穩,最終值是第二個 “穩定增長” 時期。首先,我們需要估計未來十年的現金流。在可能的情況下,我們會使用分析師的估計值,但是當這些估計值不可用時,我們會從最新的估計值或報告的價值中推斷出之前的自由現金流(FCF)。我們假設自由現金流萎縮的公司將減緩其萎縮速度,而自由現金流不斷增長的公司在此期間的增長率將放緩。我們這樣做是爲了反映早期增長的放緩幅度往往比後來的幾年更大。
差價合約就是關於未來一美元的價值低於今天一美元的概念,因此,這些未來現金流的總和將折現爲今天的價值:
10 年自由現金流 (FCF) 預測
| 2024 | 2025 | 2026 | 2027 | 2028 | 2029 | 2030 | 2031 | 2032 | 2033 | |
| Levered FCF(美元,百萬) | 164.6 億美元 | 2.285 億美元 | 504.1 億美元 | 745.6 億美元 | 12.0 億美元 | 15.8 億美元 | 19.3 億美元 | 22.4 億美元 | 2.52 億美元 | 27.5 億美元 |
| 增長率估算來源 | 分析師 x18 | 分析師 x18 | 分析師 x6 | 分析師 x4 | 分析師 x3 | 美國東部標準時間 @ 30.94% | 美國東部標準時間 @ 22.34% | 美國東部標準時間 @ 16.33% | 美國東部時間 @ 12.12% | 東部時間 @ 9.17% |
| 現值(美元,百萬)折扣@ 7.3% | 153 美元 | 198 美元 | 408 美元 | 562 美元 | 846 美元 | 1.0 萬美元 | 120 萬美元 | 130 萬美元 | 130 萬美元 | 140 萬美元 |
(“Est” = Simply Wall St估計的FCF增長率)
10 年期現金流 (PVCF) 的現值 = 83 億美元
第二階段也稱爲終值,這是企業在第一階段之後的現金流。戈登增長公式用於計算終值,其未來年增長率等於10年期國債收益率2.3%的5年平均水平。我們將終端現金流折現爲今天的價值,權益成本爲7.3%。
終端價值 (TV) = FCF2033 × (1 + g) ÷ (r — g) = 27億美元× (1 + 2.3%) ÷ (7.3% — 2.3%) = 560億美元
終端價值的現值 (PVTV) = 電視/ (1 + r)10= 560億美元÷ (1 + 7.3%)10= 280 億美元
總價值是未來十年的現金流總額加上貼現的終端價值,由此得出總權益價值,在本例中爲360億美元。爲了得出每股內在價值,我們將其除以已發行股票總數。與目前的86.8美元股價相比,該公司的公允價值似乎比目前的股價折扣了18%。但是,估值是不精確的工具,就像望遠鏡一樣——移動幾度,最終進入另一個星系。請記住這一點。
假設
現在,貼現現金流的最重要輸入是貼現率,當然還有實際現金流。你不必同意這些輸入,我建議你自己重做計算然後試一試。DCF也沒有考慮一個行業可能的週期性,也沒有考慮公司未來的資本需求,因此它沒有全面反映公司的潛在表現。鑑於我們將Cloudflare視爲潛在股東,因此使用權益成本作爲貼現率,而不是構成債務的資本成本(或加權平均資本成本,WACC)。在此計算中,我們使用了7.3%,這是基於1.093的槓桿測試版。Beta是衡量股票與整個市場相比波動性的指標。我們的測試版來自全球可比公司的行業平均貝塔值,設定在0.8到2.0之間,這是一個穩定的業務的合理範圍。
Cloudflare 的 SWOT 分析
- 現金盈餘佔債務總額。
- NET 的資產負債表摘要。
- 在過去的一年中,股東被稀釋了。
- 預計明年將減少損失。
- 根據當前的自由現金流,有足夠的現金流超過3年。
- 目前的股價低於我們對公允價值的估計。
- 運營現金流無法很好地覆蓋債務。
- 預計在未來三年內不會盈利。
- NET 有足夠的能力應對威脅嗎?
繼續前進:
就建立投資論點而言,估值只是硬幣的一面,理想情況下,它不會是你爲公司仔細研究的唯一分析內容。DCF模型不是完美的股票估值工具。相反,DCF模型的最佳用途是測試某些假設和理論,看看它們是否會導致公司被低估或高估。例如,公司權益成本或無風險利率的變化會對估值產生重大影響。對於 Cloudflare,我們整理了三個你應該考慮的相關項目:
- 風險:我們認爲,在對公司進行投資之前,您應該評估我們標記的Cloudflare的3個警告信號。
- 未來收益:與同行和整個市場相比,NET的增長率如何?通過與我們的免費分析師增長預期圖表互動,深入了解未來幾年的分析師共識數字。
- 其他高質量的替代品:你喜歡一個優秀的全能選手嗎?瀏覽我們的高品質股票互動清單,了解您可能還會錯過什麼!
PS。Simply Wall St每天都會更新每隻美國股票的差價合約計算結果,因此,如果您想找到任何其他股票的內在價值,請在此處搜索。
對這篇文章有反饋嗎?對內容感到擔憂?直接聯繫我們。 或者,給編輯團隊 (at) simplywallst.com 發送電子郵件。
Simply Wall St的這篇文章本質上是籠統的。我們僅使用公正的方法根據歷史數據和分析師的預測提供評論,我們的文章無意作爲財務建議。它不構成買入或賣出任何股票的建議,也沒有考慮到您的目標或財務狀況。我們的目標是爲您提供由基本數據驅動的長期重點分析。請注意,我們的分析可能不考慮最新的價格敏感型公司公告或定性材料。簡而言之,華爾街沒有持有任何上述股票的頭寸。
譯文內容由第三人軟體翻譯。
風險及免責聲明
- 分享到weixin
- 分享到qq
- 分享到facebook
- 分享到twitter
- 分享到微博
- 粘贴板
使用瀏覽器的分享功能,分享給你的好友吧