
Sprouts Farmers Market (NASDAQ:SFM) Stock Performs Better Than Its Underlying Earnings Growth Over Last Five Years
Sprouts Farmers Market (NASDAQ:SFM) Stock Performs Better Than Its Underlying Earnings Growth Over Last Five Years
When you buy a stock there is always a possibility that it could drop 100%. But on the bright side, you can make far more than 100% on a really good stock. Long term Sprouts Farmers Market, Inc. (NASDAQ:SFM) shareholders would be well aware of this, since the stock is up 208% in five years. It's also good to see the share price up 32% over the last quarter.
當你買入股票時,它總是有可能下跌100%。但好的一面是,購買一隻非常好的股票,您可以賺取超過100%的收入。Sprouts Farmers Market, Inc.(納斯達克股票代碼:SFM)的長期股東會意識到這一點,因爲該股在五年內上漲了208%。股價在上個季度上漲了32%也是件好事。
After a strong gain in the past week, it's worth seeing if longer term returns have been driven by improving fundamentals.
在過去一週強勁上漲之後,值得一看的是長期回報是否是由基本面改善推動的。
While the efficient markets hypothesis continues to be taught by some, it has been proven that markets are over-reactive dynamic systems, and investors are not always rational. One way to examine how market sentiment has changed over time is to look at the interaction between a company's share price and its earnings per share (EPS).
儘管一些人繼續教導高效市場假說,但事實證明,市場是反應過度的動態系統,投資者並不總是理性的。研究市場情緒如何隨着時間的推移而變化的一種方法是研究公司股價與其每股收益(EPS)之間的相互作用。
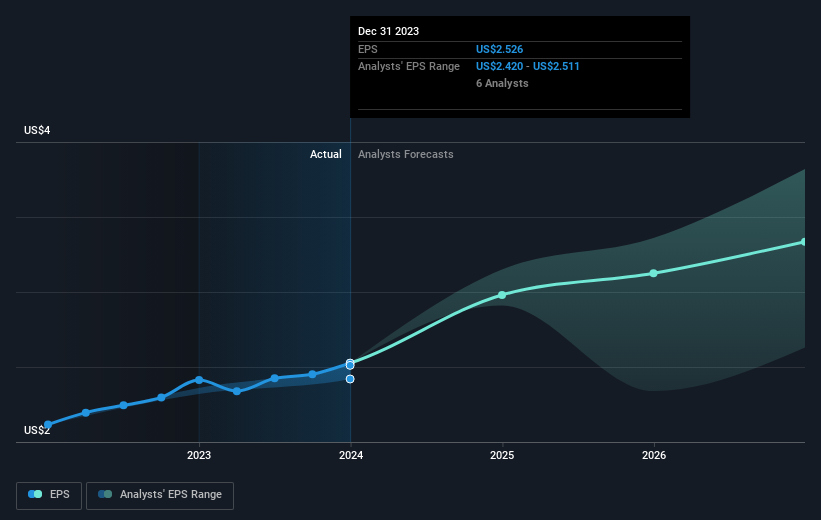
Over half a decade, Sprouts Farmers Market managed to grow its earnings per share at 16% a year. This EPS growth is lower than the 25% average annual increase in the share price. This suggests that market participants hold the company in higher regard, these days. That's not necessarily surprising considering the five-year track record of earnings growth.
在過去的五年中,Sprouts農貿市場設法將其每股收益增長到每年16%。每股收益的增長低於股價平均年增長25%。這表明,如今,市場參與者對公司的重視程度更高。考慮到五年的收益增長記錄,這並不一定令人驚訝。
The image below shows how EPS has tracked over time (if you click on the image you can see greater detail).
下圖顯示了 EPS 在一段時間內的跟蹤情況(如果你點擊圖片,你可以看到更多細節)。
Dive deeper into Sprouts Farmers Market's key metrics by checking this interactive graph of Sprouts Farmers Market's earnings, revenue and cash flow.
查看這張豆芽農貿市場收益、收入和現金流的交互式圖表,深入了解Sprouts農貿市場的關鍵指標。
A Different Perspective
不同的視角
We're pleased to report that Sprouts Farmers Market shareholders have received a total shareholder return of 92% over one year. Since the one-year TSR is better than the five-year TSR (the latter coming in at 25% per year), it would seem that the stock's performance has improved in recent times. Someone with an optimistic perspective could view the recent improvement in TSR as indicating that the business itself is getting better with time. While it is well worth considering the different impacts that market conditions can have on the share price, there are other factors that are even more important. Consider risks, for instance. Every company has them, and we've spotted 1 warning sign for Sprouts Farmers Market you should know about.
我們很高興地向大家報告,Sprouts Farmers Market的股東在一年內獲得了92%的總股東回報率。由於一年期股東總回報率好於五年期股東總回報率(後者爲每年25%),因此該股的表現似乎在最近有所改善。持樂觀態度的人可能會將最近股東總回報率的改善視爲業務本身隨着時間的推移而變得更好。儘管市場狀況可能對股價產生的不同影響值得考慮,但還有其他因素更爲重要。例如,考慮風險。每家公司都有它們,我們發現了一個你應該知道的Sprouts農貿市場的警告標誌。
Of course, you might find a fantastic investment by looking elsewhere. So take a peek at this free list of companies we expect will grow earnings.
當然,通過尋找其他地方,你可能會找到一筆不錯的投資。因此,請看一下我們預計收益將增加的這份免費公司名單。
Please note, the market returns quoted in this article reflect the market weighted average returns of stocks that currently trade on American exchanges.
請注意,本文引用的市場回報反映了目前在美國交易所交易的股票的市場加權平均回報。
Have feedback on this article? Concerned about the content? Get in touch with us directly. Alternatively, email editorial-team (at) simplywallst.com.
This article by Simply Wall St is general in nature. We provide commentary based on historical data and analyst forecasts only using an unbiased methodology and our articles are not intended to be financial advice. It does not constitute a recommendation to buy or sell any stock, and does not take account of your objectives, or your financial situation. We aim to bring you long-term focused analysis driven by fundamental data. Note that our analysis may not factor in the latest price-sensitive company announcements or qualitative material. Simply Wall St has no position in any stocks mentioned.
對這篇文章有反饋嗎?對內容感到擔憂?直接聯繫我們。 或者,給編輯團隊 (at) simplywallst.com 發送電子郵件。
Simply Wall St的這篇文章本質上是籠統的。我們僅使用公正的方法根據歷史數據和分析師的預測提供評論,我們的文章無意作爲財務建議。它不構成買入或賣出任何股票的建議,也沒有考慮到您的目標或財務狀況。我們的目標是爲您提供由基本數據驅動的長期重點分析。請注意,我們的分析可能不考慮最新的價格敏感型公司公告或定性材料。簡而言之,華爾街沒有持有任何上述股票的頭寸。
譯文內容由第三人軟體翻譯。