
Xylem Inc.'s (NYSE:XYL) On An Uptrend But Financial Prospects Look Pretty Weak: Is The Stock Overpriced?
Xylem Inc.'s (NYSE:XYL) On An Uptrend But Financial Prospects Look Pretty Weak: Is The Stock Overpriced?
Most readers would already be aware that Xylem's (NYSE:XYL) stock increased significantly by 16% over the past three months. We, however wanted to have a closer look at its key financial indicators as the markets usually pay for long-term fundamentals, and in this case, they don't look very promising. Particularly, we will be paying attention to Xylem's ROE today.
大多數讀者已經意識到,賽萊默(紐約證券交易所代碼:XYL)的股票在過去三個月中大幅增長了16%。但是,我們想仔細研究其關鍵財務指標,因爲市場通常會爲長期基本面買單,在這種情況下,它們看起來並不十分樂觀。特別是,我們今天將關注賽萊默的投資回報率。
Return on equity or ROE is a key measure used to assess how efficiently a company's management is utilizing the company's capital. In other words, it is a profitability ratio which measures the rate of return on the capital provided by the company's shareholders.
股本回報率或投資回報率是用於評估公司管理層利用公司資本效率的關鍵指標。換句話說,它是衡量公司股東提供的資本回報率的盈利比率。
How Do You Calculate Return On Equity?
你如何計算股本回報率?
The formula for ROE is:
ROE 的公式是:
Return on Equity = Net Profit (from continuing operations) ÷ Shareholders' Equity
股本回報率 = 淨利潤(來自持續經營業務)÷ 股東權益
So, based on the above formula, the ROE for Xylem is:
因此,根據上述公式,賽萊默的投資回報率爲:
6.0% = US$609m ÷ US$10b (Based on the trailing twelve months to December 2023).
6.0% = 6.09億美元 ÷ 100億美元(基於截至2023年12月的過去十二個月)。
The 'return' is the income the business earned over the last year. Another way to think of that is that for every $1 worth of equity, the company was able to earn $0.06 in profit.
“回報” 是企業在過去一年中獲得的收入。另一種思考方式是,每持有價值1美元的股權,該公司就能獲得0.06美元的利潤。
What Is The Relationship Between ROE And Earnings Growth?
投資回報率與收益增長之間有什麼關係?
We have already established that ROE serves as an efficient profit-generating gauge for a company's future earnings. We now need to evaluate how much profit the company reinvests or "retains" for future growth which then gives us an idea about the growth potential of the company. Assuming all else is equal, companies that have both a higher return on equity and higher profit retention are usually the ones that have a higher growth rate when compared to companies that don't have the same features.
我們已經確定,投資回報率是衡量公司未來收益的有效盈利指標。現在,我們需要評估公司再投資或 “保留” 了多少利潤以用於未來的增長,從而使我們對公司的增長潛力有所了解。假設其他條件都一樣,與功能不相同的公司相比,具有更高股本回報率和更高利潤保留率的公司通常具有更高的增長率。
A Side By Side comparison of Xylem's Earnings Growth And 6.0% ROE
賽萊默的收益增長和6.0%的投資回報率的並排比較
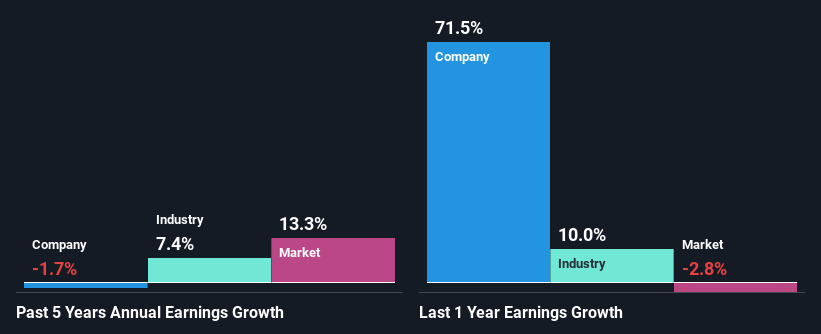
When you first look at it, Xylem's ROE doesn't look that attractive. We then compared the company's ROE to the broader industry and were disappointed to see that the ROE is lower than the industry average of 13%. As a result, Xylem's flat net income growth over the past five years doesn't come as a surprise given its lower ROE.
當你第一次看的時候,賽萊默的投資回報率看起來並不那麼吸引人。然後,我們將該公司的投資回報率與整個行業進行了比較,但對投資回報率低於行業平均水平的13%感到失望。因此,鑑於其投資回報率較低,賽萊默在過去五年中淨收入的持平增長並不令人意外。
As a next step, we compared Xylem's net income growth with the industry and discovered that the industry saw an average growth of 7.4% in the same period.
下一步,我們將賽萊默的淨收入增長與該行業進行了比較,發現該行業同期的平均增長率爲7.4%。
Earnings growth is a huge factor in stock valuation. It's important for an investor to know whether the market has priced in the company's expected earnings growth (or decline). Doing so will help them establish if the stock's future looks promising or ominous. If you're wondering about Xylem's's valuation, check out this gauge of its price-to-earnings ratio, as compared to its industry.
收益增長是股票估值的重要因素。對於投資者來說,重要的是要知道市場是否對公司的預期收益增長(或下降)進行了定價。這樣做將幫助他們確定股票的未來是樂觀還是不祥的。如果你想知道賽萊姆的估值,可以看看這個衡量賽萊姆與行業相比的市盈率指標。
Is Xylem Making Efficient Use Of Its Profits?
賽萊默是否在有效利用其利潤?
With a high three-year median payout ratio of 53% (implying that the company keeps only 47% of its income) of its business to reinvest into its business), most of Xylem's profits are being paid to shareholders, which explains the absence of growth in earnings.
賽萊默的三年派息率中位數很高,爲53%(這意味着該公司僅保留其收入的47%),用於再投資其業務),因此賽萊默的大部分利潤都支付給了股東,這解釋了收益缺乏增長的原因。
In addition, Xylem has been paying dividends over a period of at least ten years suggesting that keeping up dividend payments is way more important to the management even if it comes at the cost of business growth. Existing analyst estimates suggest that the company's future payout ratio is expected to drop to 30% over the next three years. Accordingly, the expected drop in the payout ratio explains the expected increase in the company's ROE to 10.0%, over the same period.
此外,賽萊默至少十年來一直在支付股息,這表明即使以業務增長爲代價,維持股息支付對管理層來說也更爲重要。現有的分析師估計表明,該公司未來的派息率預計將在未來三年降至30%。因此,派息率的預期下降解釋了該公司同期的投資回報率預計將增長至10.0%。
Summary
摘要
Overall, we would be extremely cautious before making any decision on Xylem. The company has seen a lack of earnings growth as a result of retaining very little profits and whatever little it does retain, is being reinvested at a very low rate of return. With that said, we studied the latest analyst forecasts and found that while the company has shrunk its earnings in the past, analysts expect its earnings to grow in the future. To know more about the company's future earnings growth forecasts take a look at this free report on analyst forecasts for the company to find out more.
總體而言,在就賽萊默做出任何決定之前,我們會非常謹慎。由於保留的利潤很少,該公司一直缺乏收益增長,無論保留的利潤很少,都以非常低的回報率進行再投資。話雖如此,我們研究了分析師的最新預測,發現儘管該公司過去曾縮減收益,但分析師預計其未來收益將增長。要了解有關公司未來收益增長預測的更多信息,請查看這份關於分析師預測的免費報告,以了解更多信息。
Have feedback on this article? Concerned about the content? Get in touch with us directly. Alternatively, email editorial-team (at) simplywallst.com.
This article by Simply Wall St is general in nature. We provide commentary based on historical data and analyst forecasts only using an unbiased methodology and our articles are not intended to be financial advice. It does not constitute a recommendation to buy or sell any stock, and does not take account of your objectives, or your financial situation. We aim to bring you long-term focused analysis driven by fundamental data. Note that our analysis may not factor in the latest price-sensitive company announcements or qualitative material. Simply Wall St has no position in any stocks mentioned.
對這篇文章有反饋嗎?對內容感到擔憂?直接聯繫我們。 或者,給編輯團隊 (at) simplywallst.com 發送電子郵件。
Simply Wall St的這篇文章本質上是籠統的。我們僅使用公正的方法根據歷史數據和分析師的預測提供評論,我們的文章無意作爲財務建議。它不構成買入或賣出任何股票的建議,也沒有考慮到您的目標或財務狀況。我們的目標是爲您提供由基本數據驅動的長期重點分析。請注意,我們的分析可能不考慮最新的價格敏感型公司公告或定性材料。簡而言之,華爾街沒有持有任何上述股票的頭寸。
譯文內容由第三人軟體翻譯。