JNJ Elliott Wave Analysis Trading Lounge Daily Chart.
Johnson & Johnson, (JNJ) Daily Chart.
JNJ Elliott Wave technical analysis
Function: Counter Trend.
Mode: Corrective.
Structure: Complex.
Position: Intermediate (2).
Direction: Downside in wave Z.
Details: Looking for support as we touched 0.618 Z vs. X. If we find resistance on Medium Level at 150 then we can expected further downside.
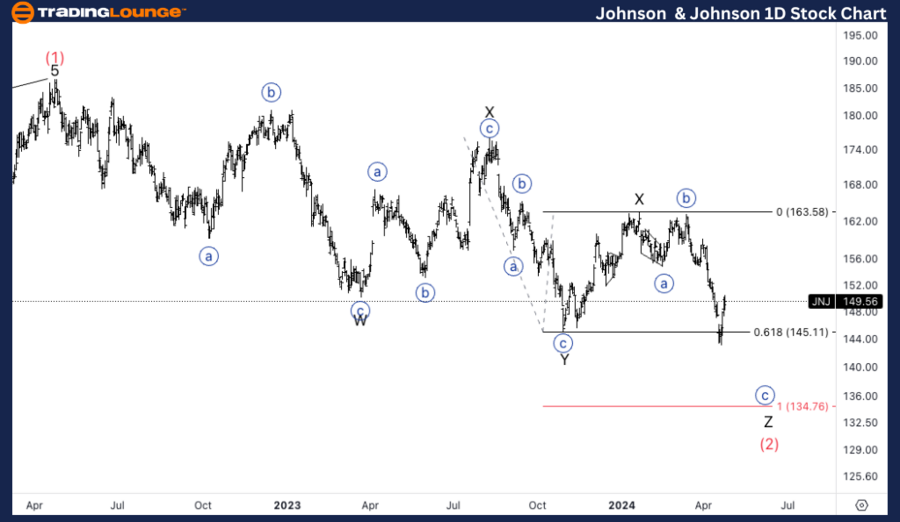
JNJ Elliott Wave technical analysis – Daily chart
Johnson & Johnson is observed in a counter trend phase characterized by a complex corrective structure, specifically placed in Intermediate wave (2). Currently, the stock is progressing through the downside movements of wave Z. Key observations indicate the stock has reached the Fibonacci retracement level of 0.618 Z vs. X, signaling a potential area for finding support. Should resistance solidify at the medium level of $150, further downside could be expected as the pattern completes.
JNJ Elliott Wave Analysis Trading Lounge 4Hr Chart,
Johnson & Johnson, (JNJ) 4Hr Chart.
JNJ Elliott Wave technical analysis
Function: Trend.
Mode: Impulsive.
Structure: Motive.
Position: Wave (iv) of {c}.
Direction: Downside into wave (v).
Details: Looking to find resistance on 150, as wave (ii) was sharp we could anticipate a sideways wave (iv), to move around 150 itself.
On April 24, 2024, we conducted a comprehensive Elliott Wave analysis on Johnson & Johnson (Ticker: JNJ), focusing on the dynamics revealed through the daily and 4-hour chart studies. Our analysis highlights crucial patterns and potential future movements, offering valuable insights for traders and investors engaged in JNJ’s stock.
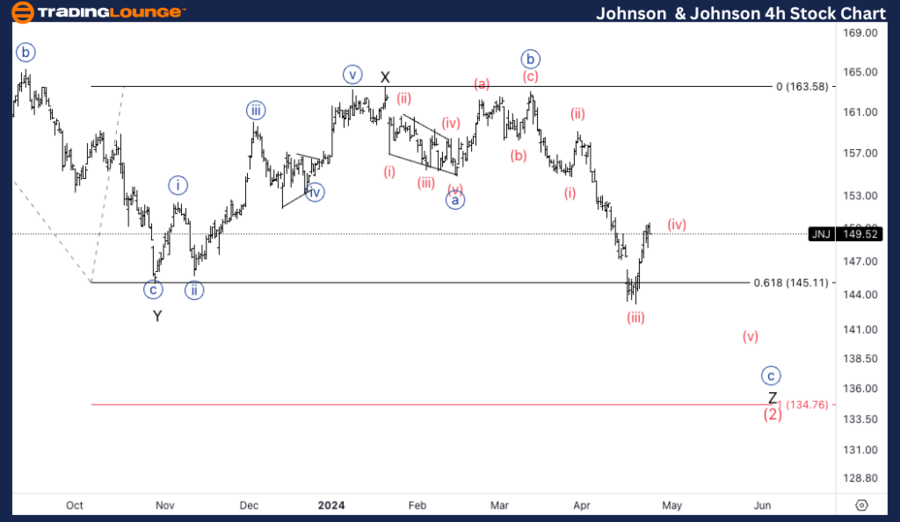
JNJ Elliott Wave technical analysis – Four hour chart
The 4-hour chart provides additional granularity into JNJ's Elliott Wave structure. Unlike the daily chart’s corrective mode, the intraday perspective shows an impulsive mode within a motive structure, pinpointing the stock in wave (iv) of {c}. This suggests that despite the broader correction, short-term dynamics involve impulsive downside movements. With wave (ii) noted as sharp, a contrasting sideways consolidation in wave (iv) is anticipated around $150, leading to a further decline in wave (v).
Technical analyst: Alessio Barretta.
JNJ Elliott Wave technical analysis [Video]
As with any investment opportunity there is a risk of making losses on investments that Trading Lounge expresses opinions on.
Historical results are no guarantee of future returns. Some investments are inherently riskier than others. At worst, you could lose your entire investment. TradingLounge™ uses a range of technical analysis tools, software and basic fundamental analysis as well as economic forecasts aimed at minimizing the potential for loss.
The advice we provide through our TradingLounge™ websites and our TradingLounge™ Membership has been prepared without considering your objectives, financial situation or needs. Reliance on such advice, information or data is at your own risk. The decision to trade and the method of trading is for you alone to decide. This information is of a general nature only, so you should, before acting upon any of the information or advice provided by us, consider the appropriateness of the advice considering your own objectives, financial situation or needs. Therefore, you should consult your financial advisor or accountant to determine whether trading in securities and derivatives products is appropriate for you considering your financial circumstances.
Recommended content
Editors’ Picks
AUD/USD: Further losses retarget the 200-day SMA

Further gains in the greenback and a bearish performance of the commodity complex bolstered the continuation of the selling pressure in AUD/USD, which this time revisited three-day lows near 0.6560.
EUR/USD: Further weakness remains on the cards

EUR/USD added to Tuesday’s pullback and retested the 1.0730 region on the back of the persistent recovery in the Greenback, always against the backdrop of the resurgence of the Fed-ECB monetary policy divergence.
Gold flirts with $2,320 as USD demand losses steam

Gold struggles to make a decisive move in either direction and moves sideways in a narrow channel above $2,300. The benchmark 10-year US Treasury bond yield clings to modest gains near 4.5% and limits XAU/USD's upside.
Bitcoin price dips to $61K range, encourages buying spree among BTC fish, dolphins and sharks

Bitcoin (BTC) price is chopping downwards on the one-day time frame, while the outlook seen in the one-week period is a horizontal trade. In this shakeout moment, data shows that large holders are using the correction to buy up BTC.
Navigating the future of precious metals

In a recent episode of the Vancouver Resource Investment Conference podcast, hosted by Jesse Day, guests Stefan Gleason and JP Cortez shared their expert analysis on the dynamics of the gold and silver markets and discussed legislative efforts to promote these metals as sound money in the United States.