
Does Allegion (NYSE:ALLE) Have A Healthy Balance Sheet?
Does Allegion (NYSE:ALLE) Have A Healthy Balance Sheet?
Some say volatility, rather than debt, is the best way to think about risk as an investor, but Warren Buffett famously said that 'Volatility is far from synonymous with risk.' When we think about how risky a company is, we always like to look at its use of debt, since debt overload can lead to ruin. We can see that Allegion plc (NYSE:ALLE) does use debt in its business. But the more important question is: how much risk is that debt creating?
有人說,波動性,而不是債務,是投資者思考風險的最佳方式,但禾倫·巴菲特曾說過一句名言:“波動性遠非風險的代名詞。”當我們思考一家公司的風險有多大時,我們總是喜歡考慮其債務的用途,因爲債務過載可能導致破產。我們可以看到,Allegion plc(紐約證券交易所代碼:ALLE)確實在其業務中使用了債務。但更重要的問題是:這筆債務會帶來多大的風險?
Why Does Debt Bring Risk?
爲什麼債務會帶來風險?
Generally speaking, debt only becomes a real problem when a company can't easily pay it off, either by raising capital or with its own cash flow. If things get really bad, the lenders can take control of the business. While that is not too common, we often do see indebted companies permanently diluting shareholders because lenders force them to raise capital at a distressed price. Of course, plenty of companies use debt to fund growth, without any negative consequences. When we think about a company's use of debt, we first look at cash and debt together.
一般而言,只有當公司無法通過籌集資金或利用自己的現金流輕鬆償還債務時,債務才會成爲真正的問題。如果情況變得非常糟糕,貸款人可以控制業務。儘管這種情況並不常見,但我們經常會看到負債公司永久稀釋股東,因爲貸款人強迫他們以不利的價格籌集資金。當然,許多公司使用債務爲增長提供資金,而不會產生任何負面影響。當我們考慮公司使用債務時,我們首先要同時考慮現金和債務。
How Much Debt Does Allegion Carry?
Allegion 揹負了多少債務?
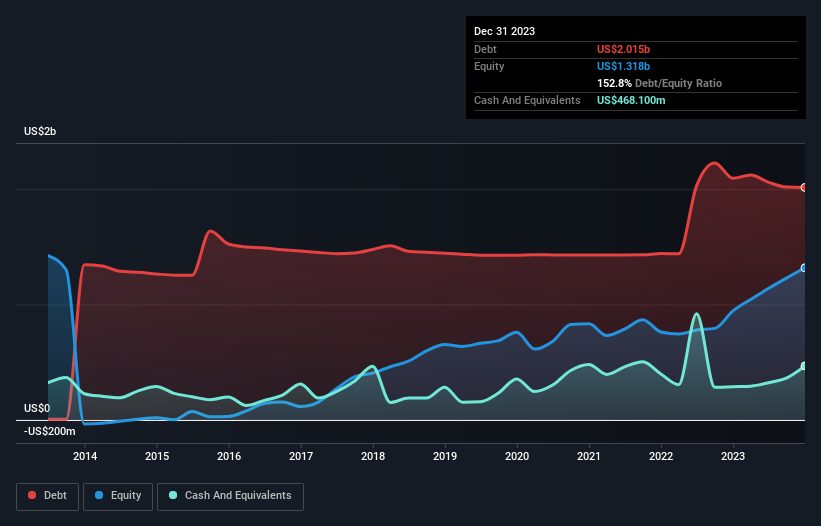
The chart below, which you can click on for greater detail, shows that Allegion had US$2.02b in debt in December 2023; about the same as the year before. However, it also had US$468.1m in cash, and so its net debt is US$1.55b.
您可以點擊下圖查看更多詳細信息,該圖表顯示,2023年12月,Allegion的債務爲20.2億美元;與前一年大致相同。但是,它也有4.681億美元的現金,因此其淨負債爲15.5億美元。
How Strong Is Allegion's Balance Sheet?
Allegion 的資產負債表有多強?
According to the last reported balance sheet, Allegion had liabilities of US$1.08b due within 12 months, and liabilities of US$1.91b due beyond 12 months. Offsetting these obligations, it had cash of US$468.1m as well as receivables valued at US$421.7m due within 12 months. So its liabilities total US$2.10b more than the combination of its cash and short-term receivables.
根據上次報告的資產負債表,Allegion的負債爲10.8億美元,12個月後到期的負債爲19.1億美元。除這些債務外,它有4.681億美元的現金以及價值4.217億美元的應收賬款在12個月內到期。因此,其負債總額比其現金和短期應收賬款的總和高出21.0億美元。
Since publicly traded Allegion shares are worth a very impressive total of US$11.0b, it seems unlikely that this level of liabilities would be a major threat. Having said that, it's clear that we should continue to monitor its balance sheet, lest it change for the worse.
由於公開交易的Allegion股票總價值令人印象深刻,達到110億美元,因此這種負債水平似乎不太可能構成重大威脅。話雖如此,很明顯,我們應該繼續監控其資產負債表,以免情況惡化。
We measure a company's debt load relative to its earnings power by looking at its net debt divided by its earnings before interest, tax, depreciation, and amortization (EBITDA) and by calculating how easily its earnings before interest and tax (EBIT) cover its interest expense (interest cover). Thus we consider debt relative to earnings both with and without depreciation and amortization expenses.
我們通過以下方法來衡量公司的債務負擔與其盈利能力:將其淨負債除以利息、稅項、折舊和攤銷前的收益(EBITDA),並計算其利息和稅前收益(EBIT)支付利息支出(利息保障)的難易程度。因此,我們將債務與收益的關係考慮在內,包括和不包括折舊和攤銷費用。
Allegion's net debt of 1.9 times EBITDA suggests graceful use of debt. And the fact that its trailing twelve months of EBIT was 8.5 times its interest expenses harmonizes with that theme. If Allegion can keep growing EBIT at last year's rate of 17% over the last year, then it will find its debt load easier to manage. The balance sheet is clearly the area to focus on when you are analysing debt. But ultimately the future profitability of the business will decide if Allegion can strengthen its balance sheet over time. So if you're focused on the future you can check out this free report showing analyst profit forecasts.
Allegion的淨負債爲息稅折舊攤銷前利潤的1.9倍,這表明債務的合理使用。而且,其過去十二個月的息稅前利潤是其利息支出的8.5倍,這一事實與這一主題一致。如果Allegion能夠保持去年的息稅前利潤比去年增長17%,那麼它將發現其債務負擔更易於管理。資產負債表顯然是分析債務時需要關注的領域。但最終,該業務未來的盈利能力將決定Allegion能否隨着時間的推移加強其資產負債表。因此,如果您專注於未來,可以查看這份顯示分析師利潤預測的免費報告。
Finally, a company can only pay off debt with cold hard cash, not accounting profits. So it's worth checking how much of that EBIT is backed by free cash flow. During the last three years, Allegion produced sturdy free cash flow equating to 71% of its EBIT, about what we'd expect. This free cash flow puts the company in a good position to pay down debt, when appropriate.
最後,公司只能用冷硬現金償還債務,不能用會計利潤償還債務。因此,值得檢查一下息稅前利潤中有多少是由自由現金流支持的。在過去三年中,Allegion產生了穩健的自由現金流,相當於其息稅前利潤的71%,與我們的預期差不多。這種自由現金流使公司處於有利地位,可以在適當的時候償還債務。
Our View
我們的觀點
Happily, Allegion's impressive conversion of EBIT to free cash flow implies it has the upper hand on its debt. And that's just the beginning of the good news since its EBIT growth rate is also very heartening. When we consider the range of factors above, it looks like Allegion is pretty sensible with its use of debt. While that brings some risk, it can also enhance returns for shareholders. The balance sheet is clearly the area to focus on when you are analysing debt. But ultimately, every company can contain risks that exist outside of the balance sheet. For instance, we've identified 2 warning signs for Allegion that you should be aware of.
令人高興的是,Allegion令人印象深刻地將息稅前利潤轉換爲自由現金流,這意味着它在債務方面佔了上風。這僅僅是好消息的開始,因爲其息稅前利潤增長率也非常令人鼓舞。當我們考慮上述一系列因素時,Allegion使用債務似乎相當明智。儘管這帶來了一些風險,但也可以提高股東的回報。資產負債表顯然是分析債務時需要關注的領域。但歸根結底,每家公司都可以控制資產負債表之外存在的風險。例如,我們已經確定了兩個你應該注意的Allegion警告信號。
If, after all that, you're more interested in a fast growing company with a rock-solid balance sheet, then check out our list of net cash growth stocks without delay.
畢竟,如果你對一家資產負債表堅如磐石的快速成長型公司更感興趣,那麼請立即查看我們的淨現金增長股票清單。
Have feedback on this article? Concerned about the content? Get in touch with us directly. Alternatively, email editorial-team (at) simplywallst.com.
This article by Simply Wall St is general in nature. We provide commentary based on historical data and analyst forecasts only using an unbiased methodology and our articles are not intended to be financial advice. It does not constitute a recommendation to buy or sell any stock, and does not take account of your objectives, or your financial situation. We aim to bring you long-term focused analysis driven by fundamental data. Note that our analysis may not factor in the latest price-sensitive company announcements or qualitative material. Simply Wall St has no position in any stocks mentioned.
對這篇文章有反饋嗎?對內容感到擔憂?直接聯繫我們。 或者,給編輯團隊 (at) simplywallst.com 發送電子郵件。
Simply Wall St的這篇文章本質上是籠統的。我們僅使用公正的方法根據歷史數據和分析師的預測提供評論,我們的文章無意作爲財務建議。它不構成買入或賣出任何股票的建議,也沒有考慮到您的目標或財務狀況。我們的目標是爲您提供由基本數據驅動的長期重點分析。請注意,我們的分析可能不考慮最新的價格敏感型公司公告或定性材料。簡而言之,華爾街沒有持有任何上述股票的頭寸。
譯文內容由第三人軟體翻譯。