
Safety Insurance Group (NASDAQ:SAFT) Shareholders Notch a 1.9% CAGR Over 5 Years, yet Earnings Have Been Shrinking
Safety Insurance Group (NASDAQ:SAFT) Shareholders Notch a 1.9% CAGR Over 5 Years, yet Earnings Have Been Shrinking
For many, the main point of investing is to generate higher returns than the overall market. But every investor is virtually certain to have both over-performing and under-performing stocks. So we wouldn't blame long term Safety Insurance Group, Inc. (NASDAQ:SAFT) shareholders for doubting their decision to hold, with the stock down 12% over a half decade.
對於許多人來說,投資的要點是產生比整個市場更高的回報。但是,幾乎每個投資者都肯定會有表現過硬和表現不佳的股票。因此,我們不會責怪安全保險集團公司(納斯達克股票代碼:SAFT)的長期股東懷疑他們的持股決定,該股在五年內下跌了12%。
While the last five years has been tough for Safety Insurance Group shareholders, this past week has shown signs of promise. So let's look at the longer term fundamentals and see if they've been the driver of the negative returns.
儘管過去五年對安全保險集團的股東來說是艱難的,但上週顯示出希望的跡象。因此,讓我們來看看長期基本面,看看它們是否是負回報的驅動力。
To quote Buffett, 'Ships will sail around the world but the Flat Earth Society will flourish. There will continue to be wide discrepancies between price and value in the marketplace...' One flawed but reasonable way to assess how sentiment around a company has changed is to compare the earnings per share (EPS) with the share price.
引用巴菲特的話說:“船隻將在世界各地航行,但Flat Earth Society將蓬勃發展。市場上的價格和價值之間將繼續存在巨大差異...”評估公司情緒變化的一種有缺陷但合理的方法是將每股收益(EPS)與股價進行比較。
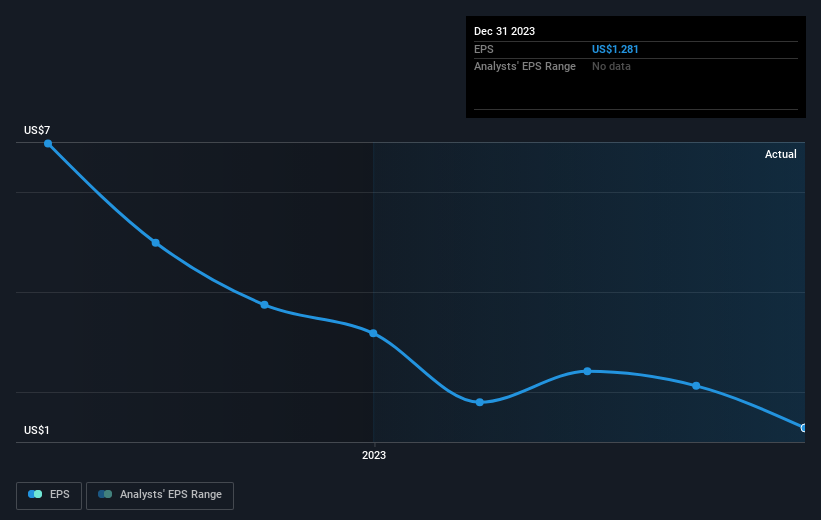
Looking back five years, both Safety Insurance Group's share price and EPS declined; the latter at a rate of 25% per year. The share price decline of 2% per year isn't as bad as the EPS decline. So the market may previously have expected a drop, or else it expects the situation will improve. The high P/E ratio of 64.54 suggests that shareholders believe earnings will grow in the years ahead.
回顧五年,安全保險集團的股價和每股收益均有所下降;後者每年下降25%。股價每年下跌2%,沒有每股收益的下降那麼嚴重。因此,市場此前可能曾預計會下跌,否則預計情況會有所改善。64.54的高市盈率表明股東認爲未來幾年收益將增長。
The company's earnings per share (over time) is depicted in the image below (click to see the exact numbers).
該公司的每股收益(隨着時間的推移)如下圖所示(點擊查看確切數字)。
We're pleased to report that the CEO is remunerated more modestly than most CEOs at similarly capitalized companies. But while CEO remuneration is always worth checking, the really important question is whether the company can grow earnings going forward. It might be well worthwhile taking a look at our free report on Safety Insurance Group's earnings, revenue and cash flow.
我們很高興地向大家報告,首席執行官的薪酬比資本相似公司的大多數首席執行官要適中。但是,儘管首席執行官的薪酬總是值得檢查的,但真正重要的問題是公司未來能否增加收益。可能值得一看我們關於安全保險集團收益、收入和現金流的免費報告。
What About Dividends?
分紅呢?
As well as measuring the share price return, investors should also consider the total shareholder return (TSR). Whereas the share price return only reflects the change in the share price, the TSR includes the value of dividends (assuming they were reinvested) and the benefit of any discounted capital raising or spin-off. Arguably, the TSR gives a more comprehensive picture of the return generated by a stock. We note that for Safety Insurance Group the TSR over the last 5 years was 9.7%, which is better than the share price return mentioned above. The dividends paid by the company have thusly boosted the total shareholder return.
除了衡量股價回報率外,投資者還應考慮股東總回報率(TSR)。儘管股價回報率僅反映股價的變化,但股東總回報率包括股息的價值(假設已進行再投資)以及任何折扣融資或分拆的收益。可以說,股東總回報率更全面地描述了股票產生的回報。我們注意到,對於安全保險集團而言,過去5年的股東總回報率爲9.7%,好於上述股價回報率。因此,該公司支付的股息提高了 總 股東回報。
A Different Perspective
不同的視角
Safety Insurance Group shareholders are up 16% for the year (even including dividends). Unfortunately this falls short of the market return. The silver lining is that the gain was actually better than the average annual return of 1.9% per year over five year. This could indicate that the company is winning over new investors, as it pursues its strategy. It's always interesting to track share price performance over the longer term. But to understand Safety Insurance Group better, we need to consider many other factors. Take risks, for example - Safety Insurance Group has 3 warning signs (and 2 which can't be ignored) we think you should know about.
安全保險集團的股東今年增長了16%(甚至包括股息)。不幸的是,這沒有達到市場回報率。一線希望是,收益實際上好於五年內每年1.9%的平均年回報率。這可能表明該公司在推行其戰略時正在贏得新投資者的青睞。長期跟蹤股價表現總是很有意思的。但是,爲了更好地了解安全保險集團,我們需要考慮許多其他因素。例如,冒險吧——安全保險集團有3個警告標誌(其中2個不容忽視),我們認爲你應該知道。
We will like Safety Insurance Group better if we see some big insider buys. While we wait, check out this free list of growing companies with considerable, recent, insider buying.
如果我們看到一些大規模的內幕收購,我們會更喜歡安全保險集團。在我們等待的同時,請查看這份免費清單,列出了最近有大量內幕收購的成長型公司。
Please note, the market returns quoted in this article reflect the market weighted average returns of stocks that currently trade on American exchanges.
請注意,本文引用的市場回報反映了目前在美國交易所交易的股票的市場加權平均回報。
Have feedback on this article? Concerned about the content? Get in touch with us directly. Alternatively, email editorial-team (at) simplywallst.com.
This article by Simply Wall St is general in nature. We provide commentary based on historical data and analyst forecasts only using an unbiased methodology and our articles are not intended to be financial advice. It does not constitute a recommendation to buy or sell any stock, and does not take account of your objectives, or your financial situation. We aim to bring you long-term focused analysis driven by fundamental data. Note that our analysis may not factor in the latest price-sensitive company announcements or qualitative material. Simply Wall St has no position in any stocks mentioned.
對這篇文章有反饋嗎?對內容感到擔憂?直接聯繫我們。 或者,給編輯團隊 (at) simplywallst.com 發送電子郵件。
Simply Wall St的這篇文章本質上是籠統的。我們僅使用公正的方法根據歷史數據和分析師的預測提供評論,我們的文章無意作爲財務建議。它不構成買入或賣出任何股票的建議,也沒有考慮到您的目標或財務狀況。我們的目標是爲您提供由基本數據驅動的長期重點分析。請注意,我們的分析可能不考慮最新的價格敏感型公司公告或定性材料。簡而言之,華爾街沒有持有任何上述股票的頭寸。
譯文內容由第三人軟體翻譯。