
 Yahoo Finance
 Cnergenz Berhad (KLSE:CNERGEN) Will Be Hoping To Turn Its Returns On Capital Around
If you're not sure where to start when looking for the next multi-bagger, there are a few key trends you should keep an eye out for. Typically, we'll want to notice a trend of growing return on capital employed (ROCE) and alongside that, an expanding base of capital employed. If you see this, it typically means it's a company with a great business model and plenty of profitable reinvestment opportunities. However, after briefly looking over the numbers, we don't think Cnergenz Berhad (KLSE:CNERGEN) has the makings of a multi-bagger going forward, but let's have a look at why that may be.
Understanding Return On Capital Employed (ROCE)
For those who don't know, ROCE is a measure of a company's yearly pre-tax profit (its return), relative to the capital employed in the business. The formula for this calculation on Cnergenz Berhad is:
Return on Capital Employed = Earnings Before Interest and Tax (EBIT) ÷ (Total Assets - Current Liabilities)
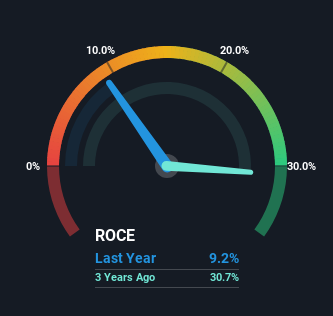
0.092 = RM15m ÷ (RM199m - RM36m) (Based on the trailing twelve months to December 2023).
So, Cnergenz Berhad has an ROCE of 9.2%. On its own, that's a low figure but it's around the 11% average generated by the Electronic industry.
See our latest analysis for Cnergenz Berhad
While the past is not representative of the future, it can be helpful to know how a company has performed historically, which is why we have this chart above. If you'd like to look at how Cnergenz Berhad has performed in the past in other metrics, you can view this free graph of Cnergenz Berhad's past earnings, revenue and cash flow.
So How Is Cnergenz Berhad's ROCE Trending?
On the surface, the trend of ROCE at Cnergenz Berhad doesn't inspire confidence. To be more specific, ROCE has fallen from 54% over the last five years. And considering revenue has dropped while employing more capital, we'd be cautious. If this were to continue, you might be looking at a company that is trying to reinvest for growth but is actually losing market share since sales haven't increased.
On a side note, Cnergenz Berhad has done well to pay down its current liabilities to 18% of total assets. That could partly explain why the ROCE has dropped. Effectively this means their suppliers or short-term creditors are funding less of the business, which reduces some elements of risk. Since the business is basically funding more of its operations with it's own money, you could argue this has made the business less efficient at generating ROCE.
In Conclusion...
In summary, we're somewhat concerned by Cnergenz Berhad's diminishing returns on increasing amounts of capital. Long term shareholders who've owned the stock over the last year have experienced a 38% depreciation in their investment, so it appears the market might not like these trends either. With underlying trends that aren't great in these areas, we'd consider looking elsewhere.
Cnergenz Berhad does come with some risks though, we found 2 warning signs in our investment analysis, and 1 of those is a bit unpleasant...
If you want to search for solid companies with great earnings, check out this free list of companies with good balance sheets and impressive returns on equity.
Have feedback on this article? Concerned about the content? Get in touch with us directly. Alternatively, email editorial-team (at) simplywallst.com.
This article by Simply Wall St is general in nature. We provide commentary based on historical data and analyst forecasts only using an unbiased methodology and our articles are not intended to be financial advice. It does not constitute a recommendation to buy or sell any stock, and does not take account of your objectives, or your financial situation. We aim to bring you long-term focused analysis driven by fundamental data. Note that our analysis may not factor in the latest price-sensitive company announcements or qualitative material. Simply Wall St has no position in any stocks mentioned.
