
GrafTech International (NYSE:EAF Investor Three-year Losses Grow to 87% as the Stock Sheds US$59m This Past Week
GrafTech International (NYSE:EAF Investor Three-year Losses Grow to 87% as the Stock Sheds US$59m This Past Week
As an investor, mistakes are inevitable. But you have a problem if you face massive losses more than once in a while. So consider, for a moment, the misfortune of GrafTech International Ltd. (NYSE:EAF) investors who have held the stock for three years as it declined a whopping 87%. That'd be enough to cause even the strongest minds some disquiet. And more recent buyers are having a tough time too, with a drop of 70% in the last year. The last week also saw the share price slip down another 13%. We really hope anyone holding through that price crash has a diversified portfolio. Even when you lose money, you don't have to lose the lesson.
作爲投資者,錯誤是不可避免的。但是,如果你不止一次地面臨巨額損失,你就會遇到問題。因此,暫時考慮一下GrafTech International Ltd.(紐約證券交易所代碼:EAF)投資者的不幸之處,他們持有該股三年,跌幅高達87%。這足以讓即使是最強的人也感到不安。最近的買家也遇到了艱難時期,去年下降了70%。上週股價還下跌了13%。我們真的希望任何在價格暴跌中堅持下去的人都能擁有多元化的投資組合。即使你賠了錢,你也不必輸掉教訓。
After losing 13% this past week, it's worth investigating the company's fundamentals to see what we can infer from past performance.
在上週下跌了13%之後,值得調查該公司的基本面,看看我們可以從過去的表現中推斷出什麼。
While the efficient markets hypothesis continues to be taught by some, it has been proven that markets are over-reactive dynamic systems, and investors are not always rational. One imperfect but simple way to consider how the market perception of a company has shifted is to compare the change in the earnings per share (EPS) with the share price movement.
儘管一些人繼續教導高效市場假說,但事實證明,市場是反應過度的動態系統,投資者並不總是理性的。考慮市場對公司的看法發生了怎樣的變化的一種不完美但簡單的方法是將每股收益(EPS)的變化與股價走勢進行比較。
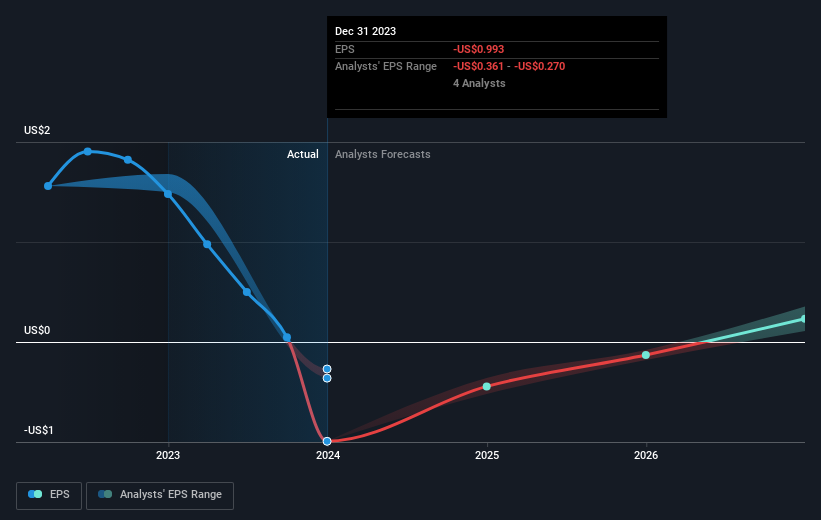
GrafTech International saw its share price decline over the three years in which its EPS also dropped, falling to a loss. Since the company has fallen to a loss making position, it's hard to compare the change in EPS with the share price change. But it's safe to say we'd generally expect the share price to be lower as a result!
GrafTech International的股價在三年中下跌,其每股收益也下降至虧損。由於該公司已跌至虧損狀態,因此很難將每股收益的變化與股價的變化進行比較。但可以肯定地說,我們通常預計股價會因此而降低!
The graphic below depicts how EPS has changed over time (unveil the exact values by clicking on the image).
下圖描述了 EPS 隨着時間的推移是如何變化的(點擊圖片可以看到確切的值)。
It might be well worthwhile taking a look at our free report on GrafTech International's earnings, revenue and cash flow.
可能值得一看我們關於GrafTech International收益、收入和現金流的免費報告。
A Different Perspective
不同的視角
While the broader market gained around 22% in the last year, GrafTech International shareholders lost 70%. However, keep in mind that even the best stocks will sometimes underperform the market over a twelve month period. Regrettably, last year's performance caps off a bad run, with the shareholders facing a total loss of 13% per year over five years. We realise that Baron Rothschild has said investors should "buy when there is blood on the streets", but we caution that investors should first be sure they are buying a high quality business. While it is well worth considering the different impacts that market conditions can have on the share price, there are other factors that are even more important. Even so, be aware that GrafTech International is showing 2 warning signs in our investment analysis , and 1 of those is concerning...
儘管去年整個市場上漲了約22%,但GrafTech International的股東卻損失了70%。但是,請記住,即使是最好的股票有時也會在十二個月內表現不如市場。遺憾的是,去年的業績結束了糟糕的表現,股東在五年內每年面臨13%的總虧損。我們意識到羅斯柴爾德男爵曾說過,投資者應該 “在街頭流血時買入”,但我們警告說,投資者應首先確保他們購買的是高質量的企業。儘管市場狀況可能對股價產生的不同影響值得考慮,但還有其他因素更爲重要。即便如此,請注意,GrafTech International在我們的投資分析中顯示了2個警告信號,其中一個是令人擔憂的...
Of course, you might find a fantastic investment by looking elsewhere. So take a peek at this free list of companies we expect will grow earnings.
當然,通過尋找其他地方,你可能會找到一筆不錯的投資。因此,請看一下我們預計收益將增加的這份免費公司名單。
Please note, the market returns quoted in this article reflect the market weighted average returns of stocks that currently trade on American exchanges.
請注意,本文引用的市場回報反映了目前在美國交易所交易的股票的市場加權平均回報。
Have feedback on this article? Concerned about the content? Get in touch with us directly. Alternatively, email editorial-team (at) simplywallst.com.
This article by Simply Wall St is general in nature. We provide commentary based on historical data and analyst forecasts only using an unbiased methodology and our articles are not intended to be financial advice. It does not constitute a recommendation to buy or sell any stock, and does not take account of your objectives, or your financial situation. We aim to bring you long-term focused analysis driven by fundamental data. Note that our analysis may not factor in the latest price-sensitive company announcements or qualitative material. Simply Wall St has no position in any stocks mentioned.
對這篇文章有反饋嗎?對內容感到擔憂?直接聯繫我們。 或者,給編輯團隊 (at) simplywallst.com 發送電子郵件。
Simply Wall St的這篇文章本質上是籠統的。我們僅使用公正的方法根據歷史數據和分析師的預測提供評論,我們的文章無意作爲財務建議。它不構成買入或賣出任何股票的建議,也沒有考慮到您的目標或財務狀況。我們的目標是爲您提供由基本數據驅動的長期重點分析。請注意,我們的分析可能不考慮最新的價格敏感型公司公告或定性材料。簡而言之,華爾街沒有持有任何上述股票的頭寸。
譯文內容由第三人軟體翻譯。