
Are Investors Undervaluing Mohawk Industries, Inc. (NYSE:MHK) By 48%?
Are Investors Undervaluing Mohawk Industries, Inc. (NYSE:MHK) By 48%?
Key Insights
關鍵見解
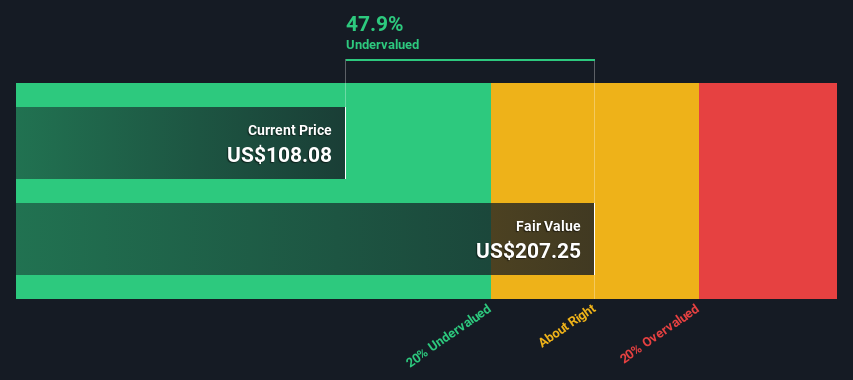
- Mohawk Industries' estimated fair value is US$207 based on 2 Stage Free Cash Flow to Equity
- Current share price of US$108 suggests Mohawk Industries is potentially 48% undervalued
- Analyst price target for MHK is US$126 which is 39% below our fair value estimate
- 根據兩階段股權自由現金流,莫霍克工業的公允價值估計爲207美元
- 目前的108美元股價表明莫霍克工業可能被低估了48%
- MHK的分析師目標股價爲126美元,比我們的公允價值估計低39%
In this article we are going to estimate the intrinsic value of Mohawk Industries, Inc. (NYSE:MHK) by projecting its future cash flows and then discounting them to today's value. This will be done using the Discounted Cash Flow (DCF) model. Models like these may appear beyond the comprehension of a lay person, but they're fairly easy to follow.
在本文中,我們將通過預測莫霍克工業公司(紐約證券交易所代碼:MHK)未來的現金流,然後將其折現爲今天的價值,來估算其內在價值。這將使用折扣現金流 (DCF) 模型來完成。像這樣的模型可能看起來超出外行人的理解,但它們很容易理解。
Remember though, that there are many ways to estimate a company's value, and a DCF is just one method. If you still have some burning questions about this type of valuation, take a look at the Simply Wall St analysis model.
但請記住,估算公司價值的方法有很多,而差價合約只是一種方法。如果你對這種估值還有一些迫切的問題,可以看看 Simply Wall St 分析模型。
Crunching The Numbers
計算數字
We use what is known as a 2-stage model, which simply means we have two different periods of growth rates for the company's cash flows. Generally the first stage is higher growth, and the second stage is a lower growth phase. To begin with, we have to get estimates of the next ten years of cash flows. Where possible we use analyst estimates, but when these aren't available we extrapolate the previous free cash flow (FCF) from the last estimate or reported value. We assume companies with shrinking free cash flow will slow their rate of shrinkage, and that companies with growing free cash flow will see their growth rate slow, over this period. We do this to reflect that growth tends to slow more in the early years than it does in later years.
我們使用所謂的兩階段模型,這僅意味着公司的現金流有兩個不同的增長期。通常,第一階段是較高的增長階段,第二階段是較低的增長階段。首先,我們必須估算出未來十年的現金流。在可能的情況下,我們會使用分析師的估計值,但是當這些估計值不可用時,我們會從最新的估計值或報告的價值中推斷出之前的自由現金流(FCF)。我們假設自由現金流萎縮的公司將減緩其萎縮速度,而自由現金流不斷增長的公司在此期間的增長率將放緩。我們這樣做是爲了反映早期增長的放緩幅度往往比後來的幾年更大。
Generally we assume that a dollar today is more valuable than a dollar in the future, and so the sum of these future cash flows is then discounted to today's value:
通常,我們假設今天的一美元比未來一美元更有價值,因此這些未來現金流的總和將折現爲今天的價值:
10-year free cash flow (FCF) estimate
10 年自由現金流 (FCF) 估計
| 2024 | 2025 | 2026 | 2027 | 2028 | 2029 | 2030 | 2031 | 2032 | 2033 | |
| Levered FCF ($, Millions) | US$694.0m | US$701.5m | US$818.4m | US$1.03b | US$1.06b | US$1.08b | US$1.11b | US$1.14b | US$1.16b | US$1.19b |
| Growth Rate Estimate Source | Analyst x6 | Analyst x6 | Analyst x3 | Analyst x1 | Analyst x1 | Est @ 2.48% | Est @ 2.42% | Est @ 2.38% | Est @ 2.36% | Est @ 2.34% |
| Present Value ($, Millions) Discounted @ 9.3% | US$635 | US$587 | US$627 | US$721 | US$678 | US$636 | US$596 | US$559 | US$523 | US$490 |
| 2024 | 2025 | 2026 | 2027 | 2028 | 2029 | 2030 | 2031 | 2032 | 2033 | |
| Levered FCF(美元,百萬) | 694.0 億美元 | 701.5 億美元 | 818.4 億美元 | 10.3 億美元 | 10.6 億美元 | 10.8 億美元 | 11.1 億美元 | 11.4 億美元 | 11.6 億美元 | 11.9 億美元 |
| 增長率估算來源 | 分析師 x6 | 分析師 x6 | 分析師 x3 | 分析師 x1 | 分析師 x1 | Est @ 2.48% | Est @ 2.42% | Est @ 2.38% | 美國東部標準時間 @ 2.36% | Est @ 2.34% |
| 現值(美元,百萬)折扣 @ 9.3% | 635 美元 | 587 美元 | 627 美元 | 721 美元 | 678 美元 | 636 美元 | 596 美元 | 559 美元 | 523 美元 | 490 美元 |
("Est" = FCF growth rate estimated by Simply Wall St)
Present Value of 10-year Cash Flow (PVCF) = US$6.1b
(“Est” = Simply Wall St估計的FCF增長率)
10 年期現金流 (PVCF) 的現值 = 61 億美元
After calculating the present value of future cash flows in the initial 10-year period, we need to calculate the Terminal Value, which accounts for all future cash flows beyond the first stage. The Gordon Growth formula is used to calculate Terminal Value at a future annual growth rate equal to the 5-year average of the 10-year government bond yield of 2.3%. We discount the terminal cash flows to today's value at a cost of equity of 9.3%.
在計算了最初10年期內未來現金流的現值之後,我們需要計算終值,該終值涵蓋了第一階段以後的所有未來現金流。戈登增長公式用於計算終值,其未來年增長率等於10年期國債收益率2.3%的5年平均水平。我們將終端現金流折現爲今天的價值,權益成本爲9.3%。
Terminal Value (TV)= FCF2033 × (1 + g) ÷ (r – g) = US$1.2b× (1 + 2.3%) ÷ (9.3%– 2.3%) = US$17b
終端價值 (TV) = FCF2033 × (1 + g) ÷ (r — g) = 12億美元× (1 + 2.3%) ÷ (9.3% — 2.3%) = 170億美元
Present Value of Terminal Value (PVTV)= TV / (1 + r)10= US$17b÷ ( 1 + 9.3%)10= US$7.2b
終端價值的現值 (PVTV) = 電視/ (1 + r)10= 170億美元÷ (1 + 9.3%)10= 72億美元
The total value is the sum of cash flows for the next ten years plus the discounted terminal value, which results in the Total Equity Value, which in this case is US$13b. In the final step we divide the equity value by the number of shares outstanding. Relative to the current share price of US$108, the company appears quite undervalued at a 48% discount to where the stock price trades currently. The assumptions in any calculation have a big impact on the valuation, so it is better to view this as a rough estimate, not precise down to the last cent.
總價值是未來十年的現金流總額加上貼現的終端價值,由此得出總權益價值,在本例中爲130億美元。在最後一步中,我們將股票價值除以已發行股票的數量。相對於目前的108美元的股價,該公司的估值似乎被嚴重低估,與目前的股價相比折扣了48%。任何計算中的假設都會對估值產生重大影響,因此最好將其視爲粗略的估計,而不是精確到最後一美分。
Important Assumptions
重要假設
We would point out that the most important inputs to a discounted cash flow are the discount rate and of course the actual cash flows. If you don't agree with these result, have a go at the calculation yourself and play with the assumptions. The DCF also does not consider the possible cyclicality of an industry, or a company's future capital requirements, so it does not give a full picture of a company's potential performance. Given that we are looking at Mohawk Industries as potential shareholders, the cost of equity is used as the discount rate, rather than the cost of capital (or weighted average cost of capital, WACC) which accounts for debt. In this calculation we've used 9.3%, which is based on a levered beta of 1.518. Beta is a measure of a stock's volatility, compared to the market as a whole. We get our beta from the industry average beta of globally comparable companies, with an imposed limit between 0.8 and 2.0, which is a reasonable range for a stable business.
我們要指出的是,貼現現金流的最重要投入是貼現率,當然還有實際的現金流。如果你不同意這些結果,那就自己計算一下,試一試假設。DCF也沒有考慮一個行業可能的週期性,也沒有考慮公司未來的資本需求,因此它沒有全面反映公司的潛在表現。鑑於我們將莫霍克工業視爲潛在股東,因此使用權益成本作爲貼現率,而不是構成債務的資本成本(或加權平均資本成本,WACC)。在此計算中,我們使用了9.3%,這是基於1.518的槓桿測試版。Beta是衡量股票與整個市場相比波動性的指標。我們的測試版來自全球可比公司的行業平均貝塔值,設定在0.8到2.0之間,這是一個穩定的業務的合理範圍。
Looking Ahead:
展望未來:
Whilst important, the DCF calculation shouldn't be the only metric you look at when researching a company. DCF models are not the be-all and end-all of investment valuation. Instead the best use for a DCF model is to test certain assumptions and theories to see if they would lead to the company being undervalued or overvalued. For example, changes in the company's cost of equity or the risk free rate can significantly impact the valuation. What is the reason for the share price sitting below the intrinsic value? For Mohawk Industries, there are three further aspects you should further examine:
儘管重要,但DCF的計算不應是你在研究公司時唯一考慮的指標。DCF模型並不是投資估值的萬能藥。相反,DCF模型的最佳用途是測試某些假設和理論,看看它們是否會導致公司被低估或高估。例如,公司權益成本或無風險利率的變化會對估值產生重大影響。股價低於內在價值的原因是什麼?對於莫霍克工業而言,您還應該進一步研究三個方面:
- Risks: Be aware that Mohawk Industries is showing 1 warning sign in our investment analysis , you should know about...
- Future Earnings: How does MHK's growth rate compare to its peers and the wider market? Dig deeper into the analyst consensus number for the upcoming years by interacting with our free analyst growth expectation chart.
- Other High Quality Alternatives: Do you like a good all-rounder? Explore our interactive list of high quality stocks to get an idea of what else is out there you may be missing!
- 風險:請注意,莫霍克工業在我們的投資分析中顯示了1個警告信號,你應該知道...
- 未來收益:與同行和整個市場相比,MHK的增長率如何?通過與我們的免費分析師增長預期圖表互動,深入了解未來幾年的分析師共識數字。
- 其他高質量的替代品:你喜歡一個優秀的全能選手嗎?瀏覽我們的高品質股票互動清單,了解您可能還會錯過什麼!
PS. Simply Wall St updates its DCF calculation for every American stock every day, so if you want to find the intrinsic value of any other stock just search here.
PS。Simply Wall St每天都會更新每隻美國股票的差價合約計算結果,因此,如果您想找到任何其他股票的內在價值,請在此處搜索。
Have feedback on this article? Concerned about the content? Get in touch with us directly. Alternatively, email editorial-team (at) simplywallst.com.
This article by Simply Wall St is general in nature. We provide commentary based on historical data and analyst forecasts only using an unbiased methodology and our articles are not intended to be financial advice. It does not constitute a recommendation to buy or sell any stock, and does not take account of your objectives, or your financial situation. We aim to bring you long-term focused analysis driven by fundamental data. Note that our analysis may not factor in the latest price-sensitive company announcements or qualitative material. Simply Wall St has no position in any stocks mentioned.
對這篇文章有反饋嗎?對內容感到擔憂?直接聯繫我們。 或者,給編輯團隊 (at) simplywallst.com 發送電子郵件。
Simply Wall St的這篇文章本質上是籠統的。我們僅使用公正的方法根據歷史數據和分析師的預測提供評論,我們的文章無意作爲財務建議。它不構成買入或賣出任何股票的建議,也沒有考慮到您的目標或財務狀況。我們的目標是爲您提供由基本數據驅動的長期重點分析。請注意,我們的分析可能不考慮最新的價格敏感型公司公告或定性材料。簡而言之,華爾街沒有持有任何上述股票的頭寸。
譯文內容由第三人軟體翻譯。