
Shyft Group (NASDAQ:SHYF) Sheds US$54m, Company Earnings and Investor Returns Have Been Trending Downwards for Past Three Years
Shyft Group (NASDAQ:SHYF) Sheds US$54m, Company Earnings and Investor Returns Have Been Trending Downwards for Past Three Years
As an investor, mistakes are inevitable. But really big losses can really drag down an overall portfolio. So consider, for a moment, the misfortune of The Shyft Group, Inc. (NASDAQ:SHYF) investors who have held the stock for three years as it declined a whopping 72%. That would be a disturbing experience. And the ride hasn't got any smoother in recent times over the last year, with the price 55% lower in that time. And the share price decline continued over the last week, dropping some 13%.
作爲投資者,錯誤是不可避免的。但是,真正的巨額虧損確實會拖累整個投資組合。因此,請暫時考慮一下Shyft Group, Inc.(納斯達克股票代碼:SHYF)投資者的不幸,他們持有該股三年,股價下跌了72%。那將是一次令人不安的經歷。而且在過去的一年裏,行程並沒有變得更加順利,同期價格下降了55%。上週股價繼續下跌,下跌了約13%。
Since Shyft Group has shed US$54m from its value in the past 7 days, let's see if the longer term decline has been driven by the business' economics.
由於Shyft Group在過去7天內已從其價值中減少了5400萬美元,因此讓我們看看長期下跌是否是由該業務的經濟推動的。
While markets are a powerful pricing mechanism, share prices reflect investor sentiment, not just underlying business performance. By comparing earnings per share (EPS) and share price changes over time, we can get a feel for how investor attitudes to a company have morphed over time.
雖然市場是一種強大的定價機制,但股價反映了投資者的情緒,而不僅僅是潛在的業務表現。通過比較每股收益(EPS)和一段時間內的股價變化,我們可以了解投資者對公司的態度是如何隨着時間的推移而變化的。
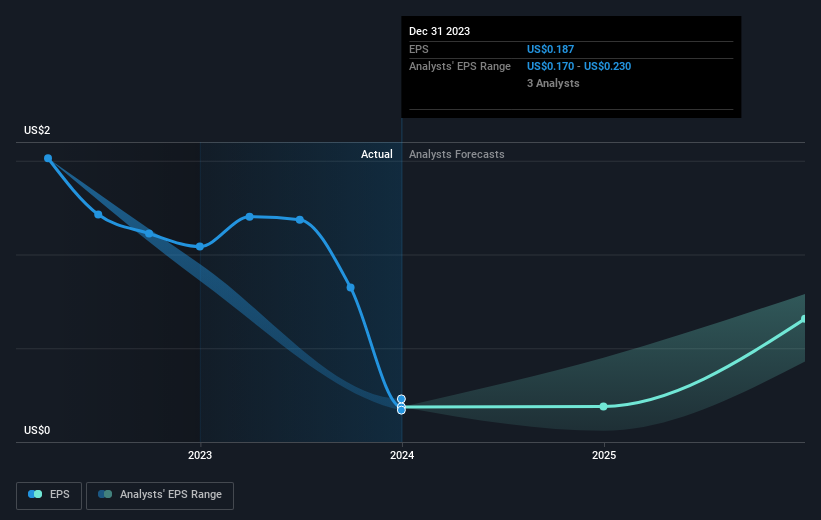
During the three years that the share price fell, Shyft Group's earnings per share (EPS) dropped by 44% each year. This fall in the EPS is worse than the 34% compound annual share price fall. So the market may not be too worried about the EPS figure, at the moment -- or it may have previously priced some of the drop in. With a P/E ratio of 55.02, it's fair to say the market sees a brighter future for the business.
在股價下跌的三年中,Shyft集團的每股收益(EPS)每年下降44%。每股收益的下降比34%的複合年股價下跌還要嚴重。因此,目前市場可能不太擔心每股收益的數字,或者此前可能已經將部分下跌定價了。市盈率爲55.02,可以公平地說,市場看到了該業務更光明的未來。
The graphic below depicts how EPS has changed over time (unveil the exact values by clicking on the image).
下圖描述了 EPS 隨着時間的推移是如何變化的(點擊圖片可以看到確切的值)。
We consider it positive that insiders have made significant purchases in the last year. Even so, future earnings will be far more important to whether current shareholders make money. Dive deeper into the earnings by checking this interactive graph of Shyft Group's earnings, revenue and cash flow.
我們認爲,內部人士在去年進行了大量收購,這是積極的。即便如此,未來的收益對於當前股東是否賺錢將更爲重要。查看這張Shyft Group收益、收入和現金流的交互式圖表,深入了解收益。
A Different Perspective
不同的視角
Investors in Shyft Group had a tough year, with a total loss of 54% (including dividends), against a market gain of about 23%. Even the share prices of good stocks drop sometimes, but we want to see improvements in the fundamental metrics of a business, before getting too interested. On the bright side, long term shareholders have made money, with a gain of 3% per year over half a decade. It could be that the recent sell-off is an opportunity, so it may be worth checking the fundamental data for signs of a long term growth trend. While it is well worth considering the different impacts that market conditions can have on the share price, there are other factors that are even more important. Consider risks, for instance. Every company has them, and we've spotted 2 warning signs for Shyft Group you should know about.
Shyft Group的投資者經歷了艱難的一年,總虧損了54%(包括股息),而市場漲幅約爲23%。即使是優質股票的股價有時也會下跌,但我們希望在過於感興趣之前看到企業基本指標的改善。好的一面是,長期股東賺了錢,在過去的五年中,每年增長3%。最近的拋售可能是一個機會,因此可能值得查看基本面數據以尋找長期增長趨勢的跡象。儘管市場狀況可能對股價產生的不同影響值得考慮,但還有其他因素更爲重要。例如,考慮風險。每家公司都有它們,我們發現了兩個你應該知道的Shyft Group警告信號。
Shyft Group is not the only stock insiders are buying. So take a peek at this free list of growing companies with insider buying.
Shyft集團並不是內部人士唯一買入的股票。因此,看看這份免費的內幕收購成長型公司名單。
Please note, the market returns quoted in this article reflect the market weighted average returns of stocks that currently trade on American exchanges.
請注意,本文引用的市場回報反映了目前在美國交易所交易的股票的市場加權平均回報。
Have feedback on this article? Concerned about the content? Get in touch with us directly. Alternatively, email editorial-team (at) simplywallst.com.
This article by Simply Wall St is general in nature. We provide commentary based on historical data and analyst forecasts only using an unbiased methodology and our articles are not intended to be financial advice. It does not constitute a recommendation to buy or sell any stock, and does not take account of your objectives, or your financial situation. We aim to bring you long-term focused analysis driven by fundamental data. Note that our analysis may not factor in the latest price-sensitive company announcements or qualitative material. Simply Wall St has no position in any stocks mentioned.
對這篇文章有反饋嗎?對內容感到擔憂?直接聯繫我們。 或者,給編輯團隊 (at) simplywallst.com 發送電子郵件。
Simply Wall St的這篇文章本質上是籠統的。我們僅使用公正的方法根據歷史數據和分析師的預測提供評論,我們的文章無意作爲財務建議。它不構成買入或賣出任何股票的建議,也沒有考慮到您的目標或財務狀況。我們的目標是爲您提供由基本數據驅動的長期重點分析。請注意,我們的分析可能不考慮最新的價格敏感型公司公告或定性材料。簡而言之,華爾街沒有持有任何上述股票的頭寸。
譯文內容由第三人軟體翻譯。