
 Yahoo Finance
 Haily Group Berhad (KLSE:HAILY) Might Be Having Difficulty Using Its Capital Effectively
If we want to find a stock that could multiply over the long term, what are the underlying trends we should look for? In a perfect world, we'd like to see a company investing more capital into its business and ideally the returns earned from that capital are also increasing. Ultimately, this demonstrates that it's a business that is reinvesting profits at increasing rates of return. However, after investigating Haily Group Berhad (KLSE:HAILY), we don't think it's current trends fit the mold of a multi-bagger.
Understanding Return On Capital Employed (ROCE)
For those that aren't sure what ROCE is, it measures the amount of pre-tax profits a company can generate from the capital employed in its business. To calculate this metric for Haily Group Berhad, this is the formula:
Return on Capital Employed = Earnings Before Interest and Tax (EBIT) ÷ (Total Assets - Current Liabilities)
0.13 = RM11m ÷ (RM186m - RM98m) (Based on the trailing twelve months to December 2023).
Therefore, Haily Group Berhad has an ROCE of 13%. On its own, that's a standard return, however it's much better than the 10% generated by the Consumer Durables industry.
Check out our latest analysis for Haily Group Berhad
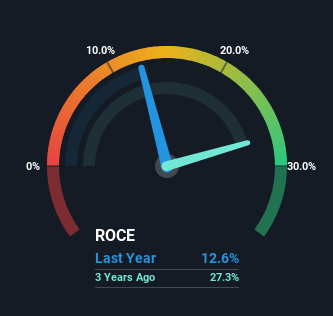
Historical performance is a great place to start when researching a stock so above you can see the gauge for Haily Group Berhad's ROCE against it's prior returns. If you'd like to look at how Haily Group Berhad has performed in the past in other metrics, you can view this free graph of Haily Group Berhad's past earnings, revenue and cash flow.
So How Is Haily Group Berhad's ROCE Trending?
On the surface, the trend of ROCE at Haily Group Berhad doesn't inspire confidence. Around five years ago the returns on capital were 27%, but since then they've fallen to 13%. Although, given both revenue and the amount of assets employed in the business have increased, it could suggest the company is investing in growth, and the extra capital has led to a short-term reduction in ROCE. If these investments prove successful, this can bode very well for long term stock performance.
On a separate but related note, it's important to know that Haily Group Berhad has a current liabilities to total assets ratio of 53%, which we'd consider pretty high. This can bring about some risks because the company is basically operating with a rather large reliance on its suppliers or other sorts of short-term creditors. While it's not necessarily a bad thing, it can be beneficial if this ratio is lower.
In Conclusion...
While returns have fallen for Haily Group Berhad in recent times, we're encouraged to see that sales are growing and that the business is reinvesting in its operations. And the stock has followed suit returning a meaningful 51% to shareholders over the last year. So while the underlying trends could already be accounted for by investors, we still think this stock is worth looking into further.
If you'd like to know more about Haily Group Berhad, we've spotted 4 warning signs, and 2 of them are a bit concerning.
While Haily Group Berhad isn't earning the highest return, check out this free list of companies that are earning high returns on equity with solid balance sheets.
Have feedback on this article? Concerned about the content? Get in touch with us directly. Alternatively, email editorial-team (at) simplywallst.com.
This article by Simply Wall St is general in nature. We provide commentary based on historical data and analyst forecasts only using an unbiased methodology and our articles are not intended to be financial advice. It does not constitute a recommendation to buy or sell any stock, and does not take account of your objectives, or your financial situation. We aim to bring you long-term focused analysis driven by fundamental data. Note that our analysis may not factor in the latest price-sensitive company announcements or qualitative material. Simply Wall St has no position in any stocks mentioned.
