
EVERTEC's (NYSE:EVTC) Earnings Growth Rate Lags the 4.5% CAGR Delivered to Shareholders
EVERTEC's (NYSE:EVTC) Earnings Growth Rate Lags the 4.5% CAGR Delivered to Shareholders
The main point of investing for the long term is to make money. But more than that, you probably want to see it rise more than the market average. But EVERTEC, Inc. (NYSE:EVTC) has fallen short of that second goal, with a share price rise of 21% over five years, which is below the market return. Zooming in, the stock is up a respectable 12% in the last year.
長期投資的要點是賺錢。但不僅如此,你可能希望看到它的漲幅超過市場平均水平。但是EVERTEC, Inc.(紐約證券交易所代碼:EVTC)尚未實現第二個目標,股價在五年內上漲了21%,低於市場回報率。放大,該股去年上漲了可觀的12%。
While the stock has fallen 6.3% this week, it's worth focusing on the longer term and seeing if the stocks historical returns have been driven by the underlying fundamentals.
儘管該股本週下跌了6.3%,但值得關注長期來看,看看股票的歷史回報是否是由基礎基本面推動的。
While the efficient markets hypothesis continues to be taught by some, it has been proven that markets are over-reactive dynamic systems, and investors are not always rational. One way to examine how market sentiment has changed over time is to look at the interaction between a company's share price and its earnings per share (EPS).
儘管一些人繼續教導高效市場假說,但事實證明,市場是反應過度的動態系統,投資者並不總是理性的。研究市場情緒如何隨着時間的推移而變化的一種方法是研究公司股價與其每股收益(EPS)之間的相互作用。
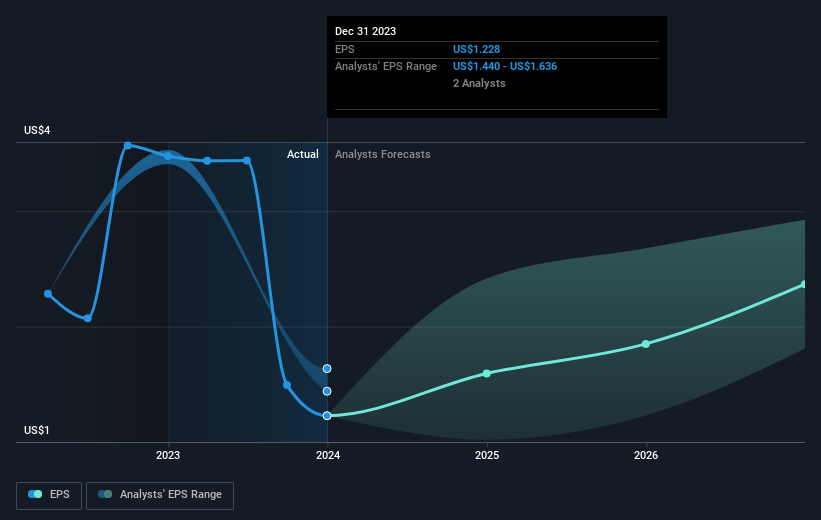
Over half a decade, EVERTEC managed to grow its earnings per share at 0.8% a year. This EPS growth is lower than the 4% average annual increase in the share price. This suggests that market participants hold the company in higher regard, these days. That's not necessarily surprising considering the five-year track record of earnings growth.
在過去的五年中,EVERTEC設法將其每股收益增長到每年0.8%。每股收益的增長低於股價每年平均增長4%。這表明,如今,市場參與者對公司的重視程度更高。考慮到五年的收益增長記錄,這並不一定令人驚訝。
The company's earnings per share (over time) is depicted in the image below (click to see the exact numbers).
該公司的每股收益(隨着時間的推移)如下圖所示(點擊查看確切數字)。
Before buying or selling a stock, we always recommend a close examination of historic growth trends, available here.
在買入或賣出股票之前,我們始終建議仔細研究歷史增長趨勢,可在此處查閱。
What About Dividends?
分紅呢?
It is important to consider the total shareholder return, as well as the share price return, for any given stock. The TSR incorporates the value of any spin-offs or discounted capital raisings, along with any dividends, based on the assumption that the dividends are reinvested. So for companies that pay a generous dividend, the TSR is often a lot higher than the share price return. As it happens, EVERTEC's TSR for the last 5 years was 25%, which exceeds the share price return mentioned earlier. This is largely a result of its dividend payments!
重要的是要考慮任何給定股票的股東總回報率和股價回報率。基於股息再投資的假設,股東總回報率納入了任何分拆或貼現資本籌集的價值以及任何股息。因此,對於支付豐厚股息的公司來說,股東總回報率通常遠高於股價回報率。碰巧的是,EVERTEC在過去5年的股東總回報率爲25%,超過了前面提到的股價回報率。這在很大程度上是其股息支付的結果!
A Different Perspective
不同的視角
EVERTEC shareholders gained a total return of 12% during the year. But that was short of the market average. On the bright side, that's still a gain, and it's actually better than the average return of 4% over half a decade This suggests the company might be improving over time. It's always interesting to track share price performance over the longer term. But to understand EVERTEC better, we need to consider many other factors. Even so, be aware that EVERTEC is showing 3 warning signs in our investment analysis , you should know about...
EVERTEC股東在年度的總回報率爲12%。但這低於市場平均水平。好的一面是,這仍然是一個收益,而且實際上好於五年來4%的平均回報率。這表明該公司可能會隨着時間的推移而有所改善。長期跟蹤股價表現總是很有意思的。但是,爲了更好地了解EVERTEC,我們需要考慮許多其他因素。即便如此,請注意,EVERTEC在我們的投資分析中顯示了3個警告信號,您應該知道...
If you would prefer to check out another company -- one with potentially superior financials -- then do not miss this free list of companies that have proven they can grow earnings.
如果你想看看另一家公司——一家財務狀況可能優異的公司——那麼千萬不要錯過這份已經證明自己可以增加收益的公司的免費名單。
Please note, the market returns quoted in this article reflect the market weighted average returns of stocks that currently trade on American exchanges.
請注意,本文引用的市場回報反映了目前在美國交易所交易的股票的市場加權平均回報。
Have feedback on this article? Concerned about the content? Get in touch with us directly. Alternatively, email editorial-team (at) simplywallst.com.
This article by Simply Wall St is general in nature. We provide commentary based on historical data and analyst forecasts only using an unbiased methodology and our articles are not intended to be financial advice. It does not constitute a recommendation to buy or sell any stock, and does not take account of your objectives, or your financial situation. We aim to bring you long-term focused analysis driven by fundamental data. Note that our analysis may not factor in the latest price-sensitive company announcements or qualitative material. Simply Wall St has no position in any stocks mentioned.
對這篇文章有反饋嗎?對內容感到擔憂?直接聯繫我們。 或者,給編輯團隊 (at) simplywallst.com 發送電子郵件。
Simply Wall St的這篇文章本質上是籠統的。我們僅使用公正的方法根據歷史數據和分析師的預測提供評論,我們的文章無意作爲財務建議。它不構成買入或賣出任何股票的建議,也沒有考慮到您的目標或財務狀況。我們的目標是爲您提供由基本數據驅動的長期重點分析。請注意,我們的分析可能不考慮最新的價格敏感型公司公告或定性材料。簡而言之,華爾街沒有持有任何上述股票的頭寸。
譯文內容由第三人軟體翻譯。