
The Return Trends At H.B. Fuller (NYSE:FUL) Look Promising
The Return Trends At H.B. Fuller (NYSE:FUL) Look Promising
What trends should we look for it we want to identify stocks that can multiply in value over the long term? In a perfect world, we'd like to see a company investing more capital into its business and ideally the returns earned from that capital are also increasing. Basically this means that a company has profitable initiatives that it can continue to reinvest in, which is a trait of a compounding machine. With that in mind, we've noticed some promising trends at H.B. Fuller (NYSE:FUL) so let's look a bit deeper.
如果我們想確定可以長期成倍增長的股票,我們應該尋找什麼趨勢?在一個完美的世界中,我們希望看到一家公司向其業務投入更多資本,理想情況下,從這些資本中獲得的回報也在增加。基本上,這意味着公司擁有可以繼續進行再投資的盈利計劃,這是複合機器的特徵。考慮到這一點,我們注意到富勒(紐約證券交易所代碼:FUL)的一些令人鼓舞的趨勢,所以讓我們更深入地了解一下。
Return On Capital Employed (ROCE): What Is It?
資本使用回報率(ROCE):這是什麼?
If you haven't worked with ROCE before, it measures the 'return' (pre-tax profit) a company generates from capital employed in its business. To calculate this metric for H.B. Fuller, this is the formula:
如果你以前沒有與ROCE合作過,它會衡量公司從其業務中使用的資本中產生的 “回報”(稅前利潤)。要計算 H.B. Fuller 的這個指標,公式如下:
Return on Capital Employed = Earnings Before Interest and Tax (EBIT) ÷ (Total Assets - Current Liabilities)
已動用資本回報率 = 息稅前收益 (EBIT) ¥(總資產-流動負債)
0.10 = US$409m ÷ (US$4.7b - US$653m) (Based on the trailing twelve months to March 2024).
0.10 = 4.09億美元 ÷(47億美元-6.53億美元) (基於截至2024年3月的過去十二個月)。
So, H.B. Fuller has an ROCE of 10%. That's a pretty standard return and it's in line with the industry average of 9.7%.
因此,富勒的投資回報率爲10%。這是一個相當標準的回報率,與9.7%的行業平均水平一致。
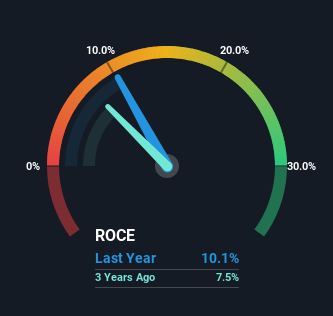
Above you can see how the current ROCE for H.B. Fuller compares to its prior returns on capital, but there's only so much you can tell from the past. If you'd like to see what analysts are forecasting going forward, you should check out our free analyst report for H.B. Fuller .
上面你可以看到富勒當前的投資回報率與其先前的資本回報率相比如何,但從過去可以看出來的只有那麼多。如果你想了解分析師對未來的預測,你應該查看我們爲富勒提供的免費分析師報告。
What Can We Tell From H.B. Fuller's ROCE Trend?
我們可以從富勒的投資回報率趨勢中得出什麼?
H.B. Fuller has not disappointed with their ROCE growth. More specifically, while the company has kept capital employed relatively flat over the last five years, the ROCE has climbed 39% in that same time. So it's likely that the business is now reaping the full benefits of its past investments, since the capital employed hasn't changed considerably. It's worth looking deeper into this though because while it's great that the business is more efficient, it might also mean that going forward the areas to invest internally for the organic growth are lacking.
富勒對其投資回報率的增長並未感到失望。更具體地說,儘管該公司在過去五年中一直保持相對平穩的資本使用率,但同期投資回報率增長了39%。因此,由於所使用的資本沒有太大變化,該企業現在很可能正在從過去的投資中獲得全部收益。但是,值得更深入地研究這個問題,因爲儘管提高業務效率是件好事,但這也可能意味着未來缺乏內部投資以實現有機增長的領域。
The Bottom Line
底線
To bring it all together, H.B. Fuller has done well to increase the returns it's generating from its capital employed. Since the stock has returned a solid 59% to shareholders over the last five years, it's fair to say investors are beginning to recognize these changes. So given the stock has proven it has promising trends, it's worth researching the company further to see if these trends are likely to persist.
總而言之,富勒在提高其使用資本產生的回報方面做得很好。由於該股在過去五年中穩步回報了59%的股東,因此可以公平地說,投資者開始意識到這些變化。因此,鑑於該股已證明其趨勢令人鼓舞,值得進一步研究該公司,看看這些趨勢是否可能持續下去。
One final note, you should learn about the 2 warning signs we've spotted with H.B. Fuller (including 1 which is potentially serious) .
最後一點是,你應該了解一下我們在 H.B. Fuller 身上發現的 2 個警告信號(包括 1 個可能很嚴重的警告)。
For those who like to invest in solid companies, check out this free list of companies with solid balance sheets and high returns on equity.
對於那些喜歡投資穩健公司的人,可以查看這份資產負債表穩健和股本回報率高的公司的免費清單。
Have feedback on this article? Concerned about the content? Get in touch with us directly. Alternatively, email editorial-team (at) simplywallst.com.
This article by Simply Wall St is general in nature. We provide commentary based on historical data and analyst forecasts only using an unbiased methodology and our articles are not intended to be financial advice. It does not constitute a recommendation to buy or sell any stock, and does not take account of your objectives, or your financial situation. We aim to bring you long-term focused analysis driven by fundamental data. Note that our analysis may not factor in the latest price-sensitive company announcements or qualitative material. Simply Wall St has no position in any stocks mentioned.
對這篇文章有反饋嗎?對內容感到擔憂?直接聯繫我們。 或者,給編輯團隊 (at) simplywallst.com 發送電子郵件。
Simply Wall St的這篇文章本質上是籠統的。我們僅使用公正的方法根據歷史數據和分析師的預測提供評論,我們的文章無意作爲財務建議。它不構成買入或賣出任何股票的建議,也沒有考慮到您的目標或財務狀況。我們的目標是爲您提供由基本數據驅動的長期重點分析。請注意,我們的分析可能不考慮最新的價格敏感型公司公告或定性材料。簡而言之,華爾街沒有持有任何上述股票的頭寸。
譯文內容由第三人軟體翻譯。