
Earnings Growth of 0.7% Over 3 Years Hasn't Been Enough to Translate Into Positive Returns for Himax Technologies (NASDAQ:HIMX) Shareholders
Earnings Growth of 0.7% Over 3 Years Hasn't Been Enough to Translate Into Positive Returns for Himax Technologies (NASDAQ:HIMX) Shareholders
For many investors, the main point of stock picking is to generate higher returns than the overall market. But if you try your hand at stock picking, your risk returning less than the market. Unfortunately, that's been the case for longer term Himax Technologies, Inc. (NASDAQ:HIMX) shareholders, since the share price is down 57% in the last three years, falling well short of the market return of around 16%. The more recent news is of little comfort, with the share price down 29% in a year. Furthermore, it's down 11% in about a quarter. That's not much fun for holders. We note that the company has reported results fairly recently; and the market is hardly delighted. You can check out the latest numbers in our company report.
對於許多投資者來說,選股的要點是產生比整個市場更高的回報。但是,如果你嘗試選股,你的風險回報低於市場。不幸的是,Himax Technologies, Inc.(納斯達克股票代碼:HIMX)的長期股東就是這種情況,因爲股價在過去三年中下跌了57%,遠低於16%左右的市場回報率。最近的消息並不令人欣慰,股價在一年內下跌了29%。此外,它在大約一個季度內下降了11%。對於持有者來說,這並不好玩。我們注意到,該公司最近公佈了業績;市場對此並不滿意。您可以在我們的公司報告中查看最新的數字。
Given the past week has been tough on shareholders, let's investigate the fundamentals and see what we can learn.
鑑於過去一週對股東來說很艱難,讓我們調查一下基本面,看看我們能學到什麼。
In his essay The Superinvestors of Graham-and-Doddsville Warren Buffett described how share prices do not always rationally reflect the value of a business. By comparing earnings per share (EPS) and share price changes over time, we can get a feel for how investor attitudes to a company have morphed over time.
在他的文章中 格雷厄姆和多茲維爾的超級投資者 禾倫·巴菲特描述了股價如何並不總是合理地反映企業的價值。通過比較每股收益(EPS)和一段時間內的股價變化,我們可以了解投資者對公司的態度是如何隨着時間的推移而變化的。
Although the share price is down over three years, Himax Technologies actually managed to grow EPS by 2.0% per year in that time. This is quite a puzzle, and suggests there might be something temporarily buoying the share price. Or else the company was over-hyped in the past, and so its growth has disappointed.
儘管股價在三年內下跌,但在此期間,Himax Technologies實際上每年設法將每股收益增長2.0%。這真是個難題,表明股價可能會暫時上漲。否則,該公司過去曾被過度炒作,因此其增長令人失望。
It looks to us like the market was probably too optimistic around growth three years ago. But it's possible a look at other metrics will be enlightening.
在我們看來,三年前市場對增長可能過於樂觀。但是,看看其他指標可能會有所啓發。
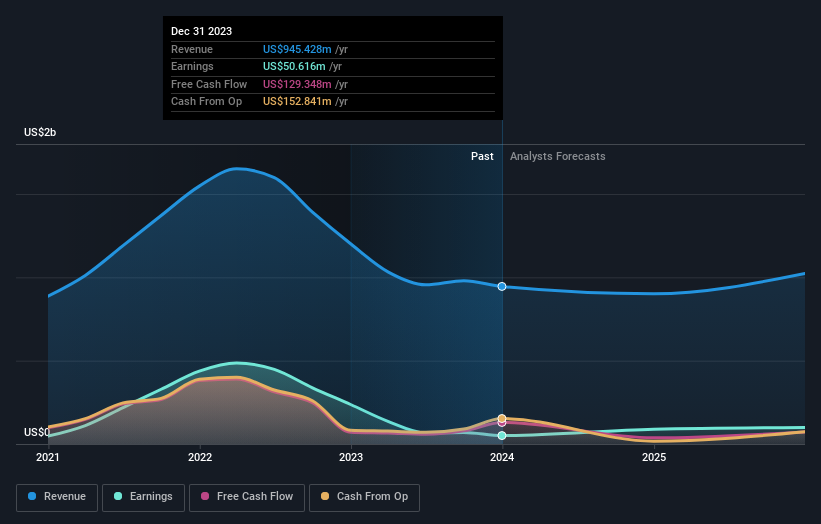
We note that the dividend seems healthy enough, so that probably doesn't explain the share price drop. On the other hand, the uninspired reduction in revenue, at 4.9% each year, may have shareholders ditching the stock. In that case, the current EPS might be viewed by some as difficult to sustain.
我們注意到,股息似乎足夠健康,因此這可能無法解釋股價下跌的原因。另一方面,收入每年無緣無故地減少4.9%,可能會導致股東拋棄該股。在這種情況下,一些人可能會認爲當前的每股收益難以維持。
The graphic below depicts how earnings and revenue have changed over time (unveil the exact values by clicking on the image).
下圖描述了收入和收入隨時間推移而發生的變化(點擊圖片即可顯示確切的數值)。
You can see how its balance sheet has strengthened (or weakened) over time in this free interactive graphic.
您可以在這張免費的交互式圖片中看到其資產負債表如何隨着時間的推移而增強(或減弱)。
What About Dividends?
分紅呢?
As well as measuring the share price return, investors should also consider the total shareholder return (TSR). Whereas the share price return only reflects the change in the share price, the TSR includes the value of dividends (assuming they were reinvested) and the benefit of any discounted capital raising or spin-off. Arguably, the TSR gives a more comprehensive picture of the return generated by a stock. We note that for Himax Technologies the TSR over the last 3 years was -46%, which is better than the share price return mentioned above. This is largely a result of its dividend payments!
除了衡量股價回報率外,投資者還應考慮股東總回報率(TSR)。儘管股價回報率僅反映股價的變化,但股東總回報率包括股息的價值(假設已進行再投資)以及任何折扣融資或分拆的收益。可以說,股東總回報率更全面地描述了股票產生的回報。我們注意到,Himax Technologies在過去3年的股東總回報率爲-46%,好於上述股價回報率。這在很大程度上是其股息支付的結果!
A Different Perspective
不同的視角
Investors in Himax Technologies had a tough year, with a total loss of 24% (including dividends), against a market gain of about 22%. However, keep in mind that even the best stocks will sometimes underperform the market over a twelve month period. On the bright side, long term shareholders have made money, with a gain of 14% per year over half a decade. It could be that the recent sell-off is an opportunity, so it may be worth checking the fundamental data for signs of a long term growth trend. While it is well worth considering the different impacts that market conditions can have on the share price, there are other factors that are even more important. Case in point: We've spotted 2 warning signs for Himax Technologies you should be aware of.
Himax Technologies的投資者經歷了艱難的一年,總虧損了24%(包括股息),而市場漲幅約爲22%。但是,請記住,即使是最好的股票有時也會在十二個月內表現不如市場。好的一面是,長期股東賺了錢,在過去的五年中,每年增長14%。最近的拋售可能是一個機會,因此可能值得查看基本面數據以尋找長期增長趨勢的跡象。儘管市場狀況可能對股價產生的不同影響值得考慮,但還有其他因素更爲重要。一個很好的例子:我們發現了兩個你應該注意的Himax Technologies警告信號。
If you like to buy stocks alongside management, then you might just love this free list of companies. (Hint: insiders have been buying them).
如果你想與管理層一起購買股票,那麼你可能會喜歡這份免費的公司名單。(提示:業內人士一直在購買它們)。
Please note, the market returns quoted in this article reflect the market weighted average returns of stocks that currently trade on American exchanges.
請注意,本文引用的市場回報反映了目前在美國交易所交易的股票的市場加權平均回報。
Have feedback on this article? Concerned about the content? Get in touch with us directly. Alternatively, email editorial-team (at) simplywallst.com.
This article by Simply Wall St is general in nature. We provide commentary based on historical data and analyst forecasts only using an unbiased methodology and our articles are not intended to be financial advice. It does not constitute a recommendation to buy or sell any stock, and does not take account of your objectives, or your financial situation. We aim to bring you long-term focused analysis driven by fundamental data. Note that our analysis may not factor in the latest price-sensitive company announcements or qualitative material. Simply Wall St has no position in any stocks mentioned.
對這篇文章有反饋嗎?對內容感到擔憂?直接聯繫我們。 或者,給編輯團隊 (at) simplywallst.com 發送電子郵件。
Simply Wall St的這篇文章本質上是籠統的。我們僅使用公正的方法根據歷史數據和分析師的預測提供評論,我們的文章無意作爲財務建議。它不構成買入或賣出任何股票的建議,也沒有考慮到您的目標或財務狀況。我們的目標是爲您提供由基本數據驅動的長期重點分析。請注意,我們的分析可能不考慮最新的價格敏感型公司公告或定性材料。簡而言之,華爾街沒有持有任何上述股票的頭寸。
譯文內容由第三人軟體翻譯。