
Are Skyline Champion Corporation (NYSE:SKY) Investors Paying Above The Intrinsic Value?
Are Skyline Champion Corporation (NYSE:SKY) Investors Paying Above The Intrinsic Value?
Key Insights
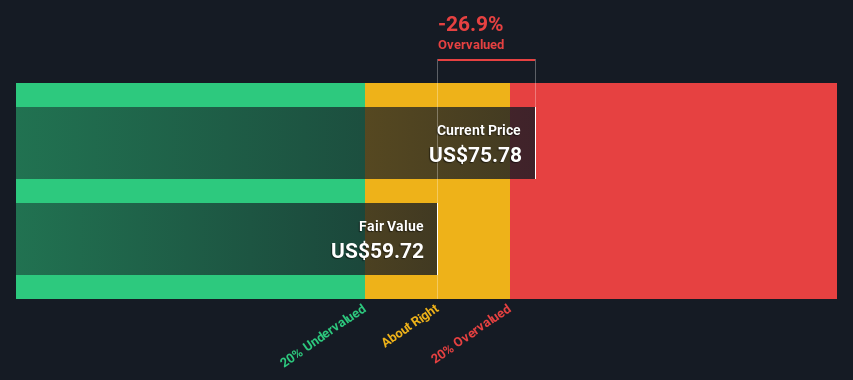
- Skyline Champion's estimated fair value is US$59.72 based on 2 Stage Free Cash Flow to Equity
- Current share price of US$75.78 suggests Skyline Champion is potentially 27% overvalued
- Analyst price target for SKY is US$79.00, which is 32% above our fair value estimate
Today we'll do a simple run through of a valuation method used to estimate the attractiveness of Skyline Champion Corporation (NYSE:SKY) as an investment opportunity by taking the expected future cash flows and discounting them to their present value. The Discounted Cash Flow (DCF) model is the tool we will apply to do this. It may sound complicated, but actually it is quite simple!
We would caution that there are many ways of valuing a company and, like the DCF, each technique has advantages and disadvantages in certain scenarios. Anyone interested in learning a bit more about intrinsic value should have a read of the Simply Wall St analysis model.
The Calculation
We're using the 2-stage growth model, which simply means we take in account two stages of company's growth. In the initial period the company may have a higher growth rate and the second stage is usually assumed to have a stable growth rate. To begin with, we have to get estimates of the next ten years of cash flows. Where possible we use analyst estimates, but when these aren't available we extrapolate the previous free cash flow (FCF) from the last estimate or reported value. We assume companies with shrinking free cash flow will slow their rate of shrinkage, and that companies with growing free cash flow will see their growth rate slow, over this period. We do this to reflect that growth tends to slow more in the early years than it does in later years.
Generally we assume that a dollar today is more valuable than a dollar in the future, so we need to discount the sum of these future cash flows to arrive at a present value estimate:
10-year free cash flow (FCF) forecast
| 2024 | 2025 | 2026 | 2027 | 2028 | 2029 | 2030 | 2031 | 2032 | 2033 | |
| Levered FCF ($, Millions) | US$196.5m | US$166.3m | US$224.8m | US$222.0m | US$221.6m | US$222.8m | US$225.2m | US$228.5m | US$232.4m | US$236.7m |
| Growth Rate Estimate Source | Analyst x3 | Analyst x4 | Analyst x4 | Est @ -1.24% | Est @ -0.18% | Est @ 0.56% | Est @ 1.08% | Est @ 1.44% | Est @ 1.70% | Est @ 1.88% |
| Present Value ($, Millions) Discounted @ 7.9% | US$182 | US$143 | US$179 | US$164 | US$151 | US$141 | US$132 | US$124 | US$117 | US$110 |
("Est" = FCF growth rate estimated by Simply Wall St)
Present Value of 10-year Cash Flow (PVCF) = US$1.4b
After calculating the present value of future cash flows in the initial 10-year period, we need to calculate the Terminal Value, which accounts for all future cash flows beyond the first stage. For a number of reasons a very conservative growth rate is used that cannot exceed that of a country's GDP growth. In this case we have used the 5-year average of the 10-year government bond yield (2.3%) to estimate future growth. In the same way as with the 10-year 'growth' period, we discount future cash flows to today's value, using a cost of equity of 7.9%.
Terminal Value (TV)= FCF2033 × (1 + g) ÷ (r – g) = US$237m× (1 + 2.3%) ÷ (7.9%– 2.3%) = US$4.3b
Present Value of Terminal Value (PVTV)= TV / (1 + r)10= US$4.3b÷ ( 1 + 7.9%)10= US$2.0b
The total value, or equity value, is then the sum of the present value of the future cash flows, which in this case is US$3.4b. To get the intrinsic value per share, we divide this by the total number of shares outstanding. Compared to the current share price of US$75.8, the company appears slightly overvalued at the time of writing. Remember though, that this is just an approximate valuation, and like any complex formula - garbage in, garbage out.
The Assumptions
The calculation above is very dependent on two assumptions. The first is the discount rate and the other is the cash flows. You don't have to agree with these inputs, I recommend redoing the calculations yourself and playing with them. The DCF also does not consider the possible cyclicality of an industry, or a company's future capital requirements, so it does not give a full picture of a company's potential performance. Given that we are looking at Skyline Champion as potential shareholders, the cost of equity is used as the discount rate, rather than the cost of capital (or weighted average cost of capital, WACC) which accounts for debt. In this calculation we've used 7.9%, which is based on a levered beta of 1.224. Beta is a measure of a stock's volatility, compared to the market as a whole. We get our beta from the industry average beta of globally comparable companies, with an imposed limit between 0.8 and 2.0, which is a reasonable range for a stable business.
SWOT Analysis for Skyline Champion
- Debt is not viewed as a risk.
- Balance sheet summary for SKY.
- Earnings declined over the past year.
- Expensive based on P/E ratio and estimated fair value.
- Annual revenue is forecast to grow faster than the American market.
- Annual earnings are forecast to grow slower than the American market.
- What else are analysts forecasting for SKY?
Looking Ahead:
Valuation is only one side of the coin in terms of building your investment thesis, and it shouldn't be the only metric you look at when researching a company. The DCF model is not a perfect stock valuation tool. Instead the best use for a DCF model is to test certain assumptions and theories to see if they would lead to the company being undervalued or overvalued. For example, changes in the company's cost of equity or the risk free rate can significantly impact the valuation. What is the reason for the share price exceeding the intrinsic value? For Skyline Champion, we've put together three pertinent elements you should further research:
- Risks: Consider for instance, the ever-present spectre of investment risk. We've identified 1 warning sign with Skyline Champion , and understanding it should be part of your investment process.
- Future Earnings: How does SKY's growth rate compare to its peers and the wider market? Dig deeper into the analyst consensus number for the upcoming years by interacting with our free analyst growth expectation chart.
- Other High Quality Alternatives: Do you like a good all-rounder? Explore our interactive list of high quality stocks to get an idea of what else is out there you may be missing!
PS. Simply Wall St updates its DCF calculation for every American stock every day, so if you want to find the intrinsic value of any other stock just search here.
Have feedback on this article? Concerned about the content? Get in touch with us directly. Alternatively, email editorial-team (at) simplywallst.com.
This article by Simply Wall St is general in nature. We provide commentary based on historical data and analyst forecasts only using an unbiased methodology and our articles are not intended to be financial advice. It does not constitute a recommendation to buy or sell any stock, and does not take account of your objectives, or your financial situation. We aim to bring you long-term focused analysis driven by fundamental data. Note that our analysis may not factor in the latest price-sensitive company announcements or qualitative material. Simply Wall St has no position in any stocks mentioned.
關鍵見解
- 根據兩階段股權自由現金流計算,Skyline Champion的公允價值估計爲59.72美元
- 目前的股價爲75.78美元,表明Skyline Champion可能被高估了27%
- SKY的分析師目標股價爲79.00美元,比我們的公允價值估計高出32%
今天,我們將簡單介紹一種估值方法,該方法通過計算預期的未來現金流並將其折現爲現值,來估計Skyline Champion Corporation(紐約證券交易所代碼:SKY)作爲投資機會的吸引力。折扣現金流(DCF)模型是我們將應用的工具。聽起來可能很複雜,但實際上很簡單!
我們要提醒的是,對公司進行估值的方法有很多,就像DCF一樣,每種技術在某些情況下都有優點和缺點。任何有興趣進一步了解內在價值的人都應該讀一讀 Simply Wall St 分析模型。
計算結果
我們使用的是兩階段增長模型,這只是意味着我們考慮了公司增長的兩個階段。在初始階段,公司的增長率可能更高,而第二階段通常被認爲具有穩定的增長率。首先,我們必須估算出未來十年的現金流。在可能的情況下,我們會使用分析師的估計值,但是當這些估計值不可用時,我們會從最新的估計值或報告的價值中推斷出之前的自由現金流(FCF)。我們假設自由現金流萎縮的公司將減緩其萎縮速度,而自由現金流不斷增長的公司在此期間的增長率將放緩。我們這樣做是爲了反映早期增長的放緩幅度往往比後來的幾年更大。
通常,我們假設今天的一美元比未來一美元更有價值,因此我們需要對這些未來現金流的總和進行折價才能得出現值估計:
10 年自由現金流 (FCF) 預測
| 2024 | 2025 | 2026 | 2027 | 2028 | 2029 | 2030 | 2031 | 2032 | 2033 | |
| Levered FCF(美元,百萬) | 196.5 億美元 | 1.663 億美元 | 2.248 億美元 | 2.220 億美元 | 22160 萬美元 | 2.228 億美元 | 225.2 億美元 | 2.285 億美元 | 2.324 億美元 | 236.7 億美元 |
| 增長率估算來源 | 分析師 x3 | 分析師 x4 | 分析師 x4 | Est @ -1.24% | Est @ -0.18% | Est @ 0.56% | 美國東部時間 @ 1.08% | Est @ 1.44% | Est @ 1.70% | Est @ 1.88% |
| 現值(美元,百萬)折扣 @ 7.9% | 182 美元 | 143 美元 | 179 美元 | 164 美元 | 151 美元 | 141 美元 | 132 美元 | 124 美元 | 117 美元 | 110 美元 |
(“Est” = Simply Wall St估計的FCF增長率)
十年期現金流(PVCF)的現值 = 14億美元
在計算了最初10年期內未來現金流的現值之後,我們需要計算終值,該終值涵蓋了第一階段以後的所有未來現金流。出於多種原因,使用的增長率非常保守,不能超過一個國家的GDP增長率。在這種情況下,我們使用10年期國債收益率的5年平均值(2.3%)來估計未來的增長。與10年 “增長” 期一樣,我們使用7.9%的股本成本將未來的現金流折現爲今天的價值。
終端價值 (TV) = FCF2033 × (1 + g) ÷ (r — g) = 2.37億美元× (1 + 2.3%) ÷ (7.9% — 2.3%) = 43億美元
終端價值的現值 (PVTV) = 電視/ (1 + r)10= 43億美元÷ (1 + 7.9%)10= 20億美元
因此,總價值或權益價值是未來現金流現值的總和,在本例中爲34億美元。爲了得出每股內在價值,我們將其除以已發行股票總數。與目前的75.8美元股價相比,該公司的估值在撰寫本文時似乎略有高估。但請記住,這只是一個近似的估值,就像任何複雜的公式一樣,垃圾進出。
假設
上面的計算在很大程度上取決於兩個假設。第一個是貼現率,另一個是現金流。你不必同意這些輸入,我建議你自己重做計算然後試一試。DCF也沒有考慮一個行業可能的週期性,也沒有考慮公司未來的資本需求,因此它沒有全面反映公司的潛在表現。鑑於我們將Skyline Champion視爲潛在股東,因此使用權益成本作爲貼現率,而不是構成債務的資本成本(或加權平均資本成本,WACC)。在此計算中,我們使用了7.9%,這是基於1.224的槓桿測試版。Beta是衡量股票與整個市場相比波動性的指標。我們的測試版來自全球可比公司的行業平均貝塔值,設定在0.8到2.0之間,這是一個穩定的業務的合理範圍。
天際線冠軍的 SWOT 分析
- 債務不被視爲風險。
- SKY 的資產負債表摘要。
- 在過去的一年中,收益有所下降。
- 根據市盈率和估計的公允價值,價格昂貴。
- 預計年收入的增長速度將快於美國市場。
- 預計年收益的增長速度將低於美國市場。
- 分析師對SKY還有什麼預測?
展望未來:
就建立投資論點而言,估值只是硬幣的一面,它不應該是你研究公司時唯一考慮的指標。DCF模型不是完美的股票估值工具。相反,DCF模型的最佳用途是測試某些假設和理論,看看它們是否會導致公司被低估或高估。例如,公司權益成本或無風險利率的變化會對估值產生重大影響。股價超過內在價值的原因是什麼?對於 Skyline Champion,我們彙總了三個相關要素,你應該進一步研究:
- 風險:舉例來說,投資風險的幽靈無處不在。我們已經確定了Skyline Champion的1個警告標誌,我們知道這應該是您投資過程的一部分。
- 未來收益:與同行和整個市場相比,SKY的增長率如何?通過與我們的免費分析師增長預期圖表互動,深入了解未來幾年的分析師共識數字。
- 其他高質量的替代品:你喜歡一個優秀的全能選手嗎?瀏覽我們的高品質股票互動清單,了解您可能還會錯過什麼!
PS。Simply Wall St每天都會更新每隻美國股票的差價合約計算結果,因此,如果您想找到任何其他股票的內在價值,請在此處搜索。
對這篇文章有反饋嗎?對內容感到擔憂?直接聯繫我們。 或者,給編輯團隊 (at) simplywallst.com 發送電子郵件。
Simply Wall St的這篇文章本質上是籠統的。我們僅使用公正的方法根據歷史數據和分析師的預測提供評論,我們的文章無意作爲財務建議。它不構成買入或賣出任何股票的建議,也沒有考慮到您的目標或財務狀況。我們的目標是爲您提供由基本數據驅動的長期重點分析。請注意,我們的分析可能不考慮最新的價格敏感型公司公告或定性材料。簡而言之,華爾街沒有持有任何上述股票的頭寸。
譯文內容由第三人軟體翻譯。
風險及免責聲明
- 分享到weixin
- 分享到qq
- 分享到facebook
- 分享到twitter
- 分享到微博
- 粘贴板
使用瀏覽器的分享功能,分享給你的好友吧