
Clean Harbors' (NYSE:CLH) Earnings Growth Rate Lags the 21% CAGR Delivered to Shareholders
Clean Harbors' (NYSE:CLH) Earnings Growth Rate Lags the 21% CAGR Delivered to Shareholders
The most you can lose on any stock (assuming you don't use leverage) is 100% of your money. But on the bright side, you can make far more than 100% on a really good stock. For example, the Clean Harbors, Inc. (NYSE:CLH) share price has soared 161% in the last half decade. Most would be very happy with that. On top of that, the share price is up 18% in about a quarter.
任何股票(假設你不使用槓桿)的最大損失是你的資金的100%。但好的一面是,購買一隻非常好的股票,您可以賺取超過100%的收入。例如,Clean Harbors, Inc.(紐約證券交易所代碼:CLH)的股價在過去五年中飆升了161%。大多數人會對此感到非常滿意。最重要的是,股價在大約一個季度內上漲了18%。
In light of the stock dropping 4.6% in the past week, we want to investigate the longer term story, and see if fundamentals have been the driver of the company's positive five-year return.
鑑於該股在過去一週下跌了4.6%,我們想調查長期情況,看看基本面是否是公司五年正回報的驅動力。
While markets are a powerful pricing mechanism, share prices reflect investor sentiment, not just underlying business performance. By comparing earnings per share (EPS) and share price changes over time, we can get a feel for how investor attitudes to a company have morphed over time.
雖然市場是一種強大的定價機制,但股價反映了投資者的情緒,而不僅僅是潛在的業務表現。通過比較每股收益(EPS)和一段時間內的股價變化,我們可以了解投資者對公司的態度是如何隨着時間的推移而變化的。
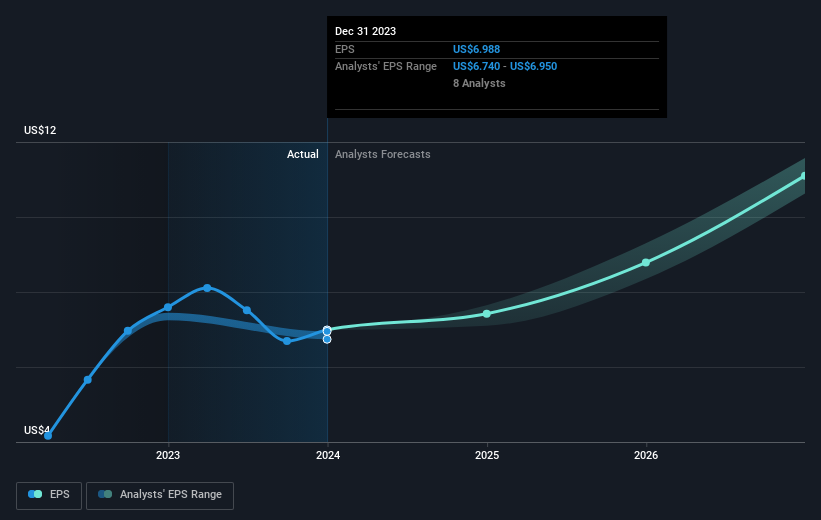
During five years of share price growth, Clean Harbors achieved compound earnings per share (EPS) growth of 43% per year. This EPS growth is higher than the 21% average annual increase in the share price. So it seems the market isn't so enthusiastic about the stock these days.
在五年的股價增長中,Clean Harbors實現了每年43%的複合每股收益(EPS)增長。每股收益的增長高於股價年均增長21%。因此,如今市場似乎對該股並不那麼熱情。
You can see below how EPS has changed over time (discover the exact values by clicking on the image).
你可以在下面看到 EPS 是如何隨着時間的推移而變化的(點擊圖片發現確切的值)。
We're pleased to report that the CEO is remunerated more modestly than most CEOs at similarly capitalized companies. It's always worth keeping an eye on CEO pay, but a more important question is whether the company will grow earnings throughout the years. Dive deeper into the earnings by checking this interactive graph of Clean Harbors' earnings, revenue and cash flow.
我們很高興地向大家報告,首席執行官的薪酬比資本相似公司的大多數首席執行官要低得多。始終值得關注首席執行官的薪酬,但更重要的問題是公司多年來是否會增加收益。查看這張Clean Harbors收益、收入和現金流的交互式圖表,深入了解收益。
A Different Perspective
不同的視角
It's good to see that Clean Harbors has rewarded shareholders with a total shareholder return of 36% in the last twelve months. Since the one-year TSR is better than the five-year TSR (the latter coming in at 21% per year), it would seem that the stock's performance has improved in recent times. Given the share price momentum remains strong, it might be worth taking a closer look at the stock, lest you miss an opportunity. While it is well worth considering the different impacts that market conditions can have on the share price, there are other factors that are even more important. Case in point: We've spotted 2 warning signs for Clean Harbors you should be aware of.
很高興看到Clean Harbors在過去十二個月中向股東提供了36%的總股東回報率。由於一年期股東總回報率好於五年期股東總回報率(後者爲每年21%),因此該股的表現似乎在最近有所改善。鑑於股價勢頭仍然強勁,可能值得仔細研究該股,以免錯過機會。儘管市場狀況可能對股價產生的不同影響值得考慮,但還有其他因素更爲重要。一個很好的例子:我們發現了 2 個你應該注意的 Clean Harbors 警告標誌。
Of course Clean Harbors may not be the best stock to buy. So you may wish to see this free collection of growth stocks.
當然,Clean Harbors可能不是最好的買入股票。因此,您可能希望看到這批免費的成長股。
Please note, the market returns quoted in this article reflect the market weighted average returns of stocks that currently trade on American exchanges.
請注意,本文引用的市場回報反映了目前在美國交易所交易的股票的市場加權平均回報。
Have feedback on this article? Concerned about the content? Get in touch with us directly. Alternatively, email editorial-team (at) simplywallst.com.
This article by Simply Wall St is general in nature. We provide commentary based on historical data and analyst forecasts only using an unbiased methodology and our articles are not intended to be financial advice. It does not constitute a recommendation to buy or sell any stock, and does not take account of your objectives, or your financial situation. We aim to bring you long-term focused analysis driven by fundamental data. Note that our analysis may not factor in the latest price-sensitive company announcements or qualitative material. Simply Wall St has no position in any stocks mentioned.
對這篇文章有反饋嗎?對內容感到擔憂?直接聯繫我們。 或者,給編輯團隊 (at) simplywallst.com 發送電子郵件。
Simply Wall St的這篇文章本質上是籠統的。我們僅使用公正的方法根據歷史數據和分析師的預測提供評論,我們的文章無意作爲財務建議。它不構成買入或賣出任何股票的建議,也沒有考慮到您的目標或財務狀況。我們的目標是爲您提供由基本數據驅動的長期重點分析。請注意,我們的分析可能不考慮最新的價格敏感型公司公告或定性材料。簡而言之,華爾街沒有持有任何上述股票的頭寸。
譯文內容由第三人軟體翻譯。