
Estimating The Intrinsic Value Of CRISPR Therapeutics AG (NASDAQ:CRSP)
Estimating The Intrinsic Value Of CRISPR Therapeutics AG (NASDAQ:CRSP)
Key Insights
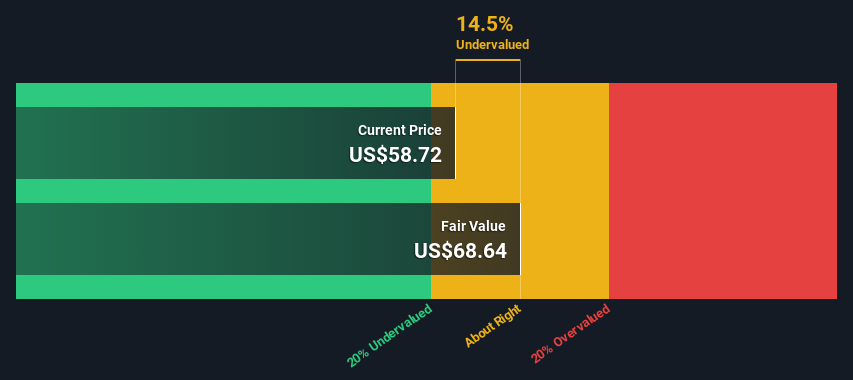
- Using the 2 Stage Free Cash Flow to Equity, CRISPR Therapeutics fair value estimate is US$68.64
- Current share price of US$58.72 suggests CRISPR Therapeutics is potentially trading close to its fair value
- Analyst price target for CRSP is US$88.08, which is 28% above our fair value estimate
Does the April share price for CRISPR Therapeutics AG (NASDAQ:CRSP) reflect what it's really worth? Today, we will estimate the stock's intrinsic value by estimating the company's future cash flows and discounting them to their present value. Our analysis will employ the Discounted Cash Flow (DCF) model. Models like these may appear beyond the comprehension of a lay person, but they're fairly easy to follow.
Companies can be valued in a lot of ways, so we would point out that a DCF is not perfect for every situation. If you still have some burning questions about this type of valuation, take a look at the Simply Wall St analysis model.
Crunching The Numbers
We are going to use a two-stage DCF model, which, as the name states, takes into account two stages of growth. The first stage is generally a higher growth period which levels off heading towards the terminal value, captured in the second 'steady growth' period. To begin with, we have to get estimates of the next ten years of cash flows. Where possible we use analyst estimates, but when these aren't available we extrapolate the previous free cash flow (FCF) from the last estimate or reported value. We assume companies with shrinking free cash flow will slow their rate of shrinkage, and that companies with growing free cash flow will see their growth rate slow, over this period. We do this to reflect that growth tends to slow more in the early years than it does in later years.
A DCF is all about the idea that a dollar in the future is less valuable than a dollar today, so we discount the value of these future cash flows to their estimated value in today's dollars:
10-year free cash flow (FCF) forecast
| 2024 | 2025 | 2026 | 2027 | 2028 | 2029 | 2030 | 2031 | 2032 | 2033 | |
| Levered FCF ($, Millions) | -US$283.6m | -US$313.9m | -US$233.8m | -US$80.3m | US$105.0m | US$162.3m | US$225.4m | US$288.3m | US$346.5m | US$398.0m |
| Growth Rate Estimate Source | Analyst x7 | Analyst x7 | Analyst x6 | Analyst x6 | Analyst x6 | Est @ 54.55% | Est @ 38.87% | Est @ 27.90% | Est @ 20.21% | Est @ 14.84% |
| Present Value ($, Millions) Discounted @ 6.2% | -US$267 | -US$278 | -US$195 | -US$63.1 | US$77.7 | US$113 | US$148 | US$178 | US$202 | US$218 |
("Est" = FCF growth rate estimated by Simply Wall St)
Present Value of 10-year Cash Flow (PVCF) = US$133m
We now need to calculate the Terminal Value, which accounts for all the future cash flows after this ten year period. For a number of reasons a very conservative growth rate is used that cannot exceed that of a country's GDP growth. In this case we have used the 5-year average of the 10-year government bond yield (2.3%) to estimate future growth. In the same way as with the 10-year 'growth' period, we discount future cash flows to today's value, using a cost of equity of 6.2%.
Terminal Value (TV)= FCF2033 × (1 + g) ÷ (r – g) = US$398m× (1 + 2.3%) ÷ (6.2%– 2.3%) = US$10b
Present Value of Terminal Value (PVTV)= TV / (1 + r)10= US$10b÷ ( 1 + 6.2%)10= US$5.7b
The total value is the sum of cash flows for the next ten years plus the discounted terminal value, which results in the Total Equity Value, which in this case is US$5.8b. To get the intrinsic value per share, we divide this by the total number of shares outstanding. Compared to the current share price of US$58.7, the company appears about fair value at a 14% discount to where the stock price trades currently. Remember though, that this is just an approximate valuation, and like any complex formula - garbage in, garbage out.
Important Assumptions
The calculation above is very dependent on two assumptions. The first is the discount rate and the other is the cash flows. You don't have to agree with these inputs, I recommend redoing the calculations yourself and playing with them. The DCF also does not consider the possible cyclicality of an industry, or a company's future capital requirements, so it does not give a full picture of a company's potential performance. Given that we are looking at CRISPR Therapeutics as potential shareholders, the cost of equity is used as the discount rate, rather than the cost of capital (or weighted average cost of capital, WACC) which accounts for debt. In this calculation we've used 6.2%, which is based on a levered beta of 0.851. Beta is a measure of a stock's volatility, compared to the market as a whole. We get our beta from the industry average beta of globally comparable companies, with an imposed limit between 0.8 and 2.0, which is a reasonable range for a stable business.
SWOT Analysis for CRISPR Therapeutics
- Currently debt free.
- Balance sheet summary for CRSP.
- Shareholders have been diluted in the past year.
- Has sufficient cash runway for more than 3 years based on current free cash flows.
- Current share price is below our estimate of fair value.
- Not expected to become profitable over the next 3 years.
- What else are analysts forecasting for CRSP?
Looking Ahead:
Although the valuation of a company is important, it ideally won't be the sole piece of analysis you scrutinize for a company. It's not possible to obtain a foolproof valuation with a DCF model. Instead the best use for a DCF model is to test certain assumptions and theories to see if they would lead to the company being undervalued or overvalued. If a company grows at a different rate, or if its cost of equity or risk free rate changes sharply, the output can look very different. For CRISPR Therapeutics, we've put together three essential elements you should assess:
- Risks: You should be aware of the 2 warning signs for CRISPR Therapeutics we've uncovered before considering an investment in the company.
- Future Earnings: How does CRSP's growth rate compare to its peers and the wider market? Dig deeper into the analyst consensus number for the upcoming years by interacting with our free analyst growth expectation chart.
- Other Solid Businesses: Low debt, high returns on equity and good past performance are fundamental to a strong business. Why not explore our interactive list of stocks with solid business fundamentals to see if there are other companies you may not have considered!
PS. The Simply Wall St app conducts a discounted cash flow valuation for every stock on the NASDAQGM every day. If you want to find the calculation for other stocks just search here.
Have feedback on this article? Concerned about the content? Get in touch with us directly. Alternatively, email editorial-team (at) simplywallst.com.
This article by Simply Wall St is general in nature. We provide commentary based on historical data and analyst forecasts only using an unbiased methodology and our articles are not intended to be financial advice. It does not constitute a recommendation to buy or sell any stock, and does not take account of your objectives, or your financial situation. We aim to bring you long-term focused analysis driven by fundamental data. Note that our analysis may not factor in the latest price-sensitive company announcements or qualitative material. Simply Wall St has no position in any stocks mentioned.
關鍵見解
- 使用兩階段的自由現金流股權,CRISPR Therapeutics的公允價值估計爲68.64美元
- 目前的股價爲58.72美元,表明CRISPR Therapeutics的交易價格可能接近其公允價值
- 分析師對CRSP的目標股價爲88.08美元,比我們的公允價值估計高出28%
CRISPR Therapeutics AG(納斯達克股票代碼:CRSP)4月份的股價是否反映了其真正價值?今天,我們將通過估算公司未來的現金流並將其折現爲現值來估算股票的內在價值。我們的分析將採用貼現現金流(DCF)模型。像這樣的模型可能看起來超出外行人的理解,但它們很容易理解。
公司可以在很多方面得到估值,因此我們要指出,DCF並不適合所有情況。如果你對這種估值還有一些迫切的問題,可以看看 Simply Wall St 分析模型。
計算數字
我們將使用兩階段的DCF模型,顧名思義,該模型考慮了兩個增長階段。第一階段通常是較高的增長期,在第二個 “穩步增長” 時期逐漸趨於平穩,最終值是第二個 “穩定增長” 時期。首先,我們必須估算出未來十年的現金流。在可能的情況下,我們會使用分析師的估計值,但是當這些估計值不可用時,我們會從最新的估計值或報告的價值中推斷出之前的自由現金流(FCF)。我們假設自由現金流萎縮的公司將減緩其萎縮速度,而自由現金流不斷增長的公司在此期間的增長率將放緩。我們這樣做是爲了反映早期增長的放緩幅度往往比後來的幾年更大。
差價合約就是關於未來一美元的價值低於今天一美元的概念,因此我們將這些未來現金流的價值折現爲以今天的美元計算的估計價值:
10 年自由現金流 (FCF) 預測
| 2024 | 2025 | 2026 | 2027 | 2028 | 2029 | 2030 | 2031 | 2032 | 2033 | |
| Levered FCF(美元,百萬) | -283.6 億美元 | -3.139 億美元 | -233.8 億美元 | -8,030萬美元 | 1.05 億美元 | 162.3 億美元 | 2.254 億美元 | 2.883 億美元 | 3.465 億美元 | 398.0 億美元 |
| 增長率估算來源 | 分析師 x7 | 分析師 x7 | 分析師 x6 | 分析師 x6 | 分析師 x6 | 美國東部標準時間 @ 54.55% | 美國東部標準時間 @ 38.87% | 美國東部時間 @ 27.90% | 美國東部標準時間 @ 20.21% | 美國東部標準時間 @ 14.84% |
| 現值(美元,百萬)折扣 @ 6.2% | -267 美元 | -278 美元 | -195 美元 | -63.1 美元 | 77.7 美元 | 113 美元 | 148 美元 | 178 美元 | 202 美元 | 218 美元 |
(“Est” = Simply Wall St估計的FCF增長率)
10 年期現金流 (PVCF) 的現值 = 1.33億美元
我們現在需要計算終值,該終值涵蓋了這十年之後的所有未來現金流量。出於多種原因,使用的增長率非常保守,不能超過一個國家的GDP增長率。在這種情況下,我們使用10年期國債收益率的5年平均值(2.3%)來估計未來的增長。與10年 “增長” 期一樣,我們將未來的現金流折現爲今天的價值,使用6.2%的股本成本。
終端價值 (TV) = FCF2033 × (1 + g) ÷ (r — g) = 3.98億美元× (1 + 2.3%) ÷ (6.2% — 2.3%) = 100億美元
終端價值的現值 (PVTV) = 電視/ (1 + r)10= 100億美元÷ (1 + 6.2%)10= 57 億美元
總價值是未來十年的現金流總額加上貼現的終端價值,由此得出總權益價值,在本例中爲58億美元。爲了得出每股內在價值,我們將其除以已發行股票總數。與目前的58.7美元股價相比,該公司的公允價值似乎比目前的股價折扣了14%。但請記住,這只是一個近似的估值,就像任何複雜的公式一樣,垃圾進出。
重要假設
上面的計算在很大程度上取決於兩個假設。第一個是貼現率,另一個是現金流。你不必同意這些輸入,我建議你自己重做計算然後試一試。DCF也沒有考慮一個行業可能的週期性,也沒有考慮公司未來的資本需求,因此它沒有全面反映公司的潛在表現。鑑於我們將CRISPR Therapeutics視爲潛在股東,因此使用股本成本作爲貼現率,而不是構成債務的資本成本(或加權平均資本成本,WACC)。在此計算中,我們使用了6.2%,這是基於0.851的槓桿貝塔值。Beta是衡量股票與整個市場相比波動性的指標。我們的測試版來自全球可比公司的行業平均貝塔值,設定在0.8到2.0之間,這是一個穩定的業務的合理範圍。
CRISPR 療法的 SWOT 分析
- 目前無債務。
- CRSP 的資產負債表摘要。
- 在過去的一年中,股東被稀釋了。
- 根據當前的自由現金流,有足夠的現金流超過3年。
- 目前的股價低於我們對公允價值的估計。
- 預計在未來三年內不會盈利。
- 分析師對CRSP還有什麼預測?
展望未來:
儘管公司的估值很重要,但理想情況下,它不會是你仔細檢查公司的唯一分析內容。使用DCF模型不可能獲得萬無一失的估值。相反,DCF模型的最佳用途是測試某些假設和理論,看看它們是否會導致公司被低估或高估。如果一家公司以不同的速度增長,或者其股本成本或無風險利率急劇變化,則產出可能會大不相同。對於CRISPR療法,我們彙總了您應該評估的三個基本要素:
- 風險:在考慮投資CRISPR Therapeutics之前,您應該注意我們發現的CRISPR Therapeutics的兩個警告信號。
- 未來收益:與同行和整個市場相比,CRSP的增長率如何?通過與我們的免費分析師增長預期圖表互動,深入了解未來幾年的分析師共識數字。
- 其他穩健的業務:低債務、高股本回報率和良好的過去表現是強大業務的基礎。爲什麼不瀏覽我們具有堅實業務基礎的股票互動清單,看看是否還有其他你可能沒有考慮過的公司!
PS。Simply Wall St應用程序每天對納斯達克通用汽車的每隻股票進行折扣現金流估值。如果您想找到其他股票的計算方法,請在此處搜索。
對這篇文章有反饋嗎?對內容感到擔憂?直接聯繫我們。 或者,給編輯團隊 (at) simplywallst.com 發送電子郵件。
Simply Wall St的這篇文章本質上是籠統的。我們僅使用公正的方法根據歷史數據和分析師的預測提供評論,我們的文章無意作爲財務建議。它不構成買入或賣出任何股票的建議,也沒有考慮到您的目標或財務狀況。我們的目標是爲您提供由基本數據驅動的長期重點分析。請注意,我們的分析可能不考慮最新的價格敏感型公司公告或定性材料。簡而言之,華爾街沒有持有任何上述股票的頭寸。
譯文內容由第三人軟體翻譯。
風險及免責聲明
- 分享到weixin
- 分享到qq
- 分享到facebook
- 分享到twitter
- 分享到微博
- 粘贴板
使用瀏覽器的分享功能,分享給你的好友吧