
Bank of America Stock: Technical Outlook Prior To Q1 Earnings
Bank of America Stock: Technical Outlook Prior To Q1 Earnings
Bank of America Corp (NYSE:BAC) will announce its first-quarter earnings on April 16. Wall Street expects 77 cents for EPS and $25.4 billion in revenues as the company reports before market hours.
美國銀行(紐約證券交易所代碼:BAC)將於4月16日公佈其第一季度業績。華爾街在盤前公佈的預計,每股收益爲77美分,收入爲254億美元。
Bank of America stock is up over 25% over the past year, 6.3% YTD.
美國銀行股價在過去一年中上漲了25%以上,年初至今上漲了6.3%。
Here's how the stock's technicals are set up ahead of earnings.
以下是該股在盈利之前的技術指標是如何設置的。
Bank of America Stock Technical Setup Ahead Of Q1 Earnings
美國銀行第一季度業績前的股票技術設置
The technical analysis of Bank of America stock suggests a moderately bearish, with slight selling pressure.
美國銀行股票的技術分析顯示出適度看跌,略有拋售壓力。
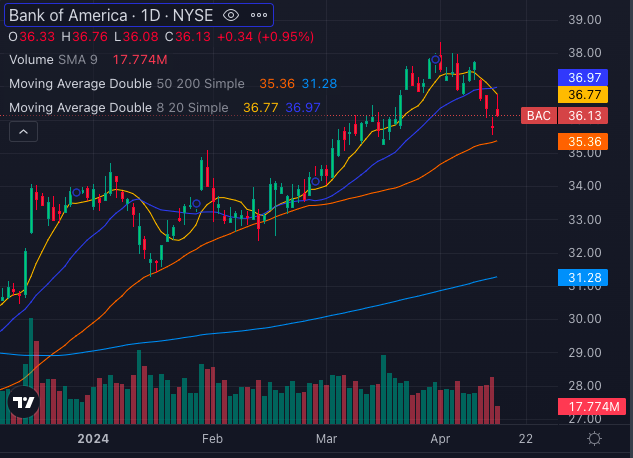
Chart: Benzinga Pro
圖表:Benzinga Pro
Bank of America's share price of $36.13 is below its 8-day and 20-day simple moving averages (SMA), signaling a bearish trend. However, it is above its 50-day SMA, indicating a bullish signal. Moreover, Bank of America's share price exceeds its 200-day SMA, reinforcing a bullish sentiment.
美國銀行36.13美元的股價低於其8天和20天簡單移動平均線(SMA),表明看跌趨勢。但是,它高於50天均線,表明看漲信號。此外,美國銀行的股價超過了200天均線,強化了看漲情緒。
In terms of exponential moving averages (EMA) too, Bank of America's price is below both the 8-day and 20-day EMAs, suggesting a bearish trend. However, it remains above the 50-day EMA, implying a bullish signal.
就指數移動平均線(EMA)而言,美國銀行的價格也低於8天和20天均線,這表明存在看跌趨勢。但是,它仍高於50天均線,這意味着看漲信號。
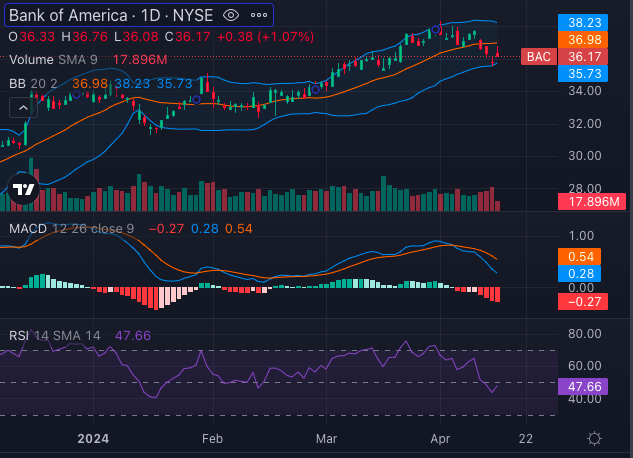
Chart: Benzinga Pro
圖表:Benzinga Pro
The Moving Average Convergence Divergence (MACD) indicator stands at 0.28, further supporting a bullish sentiment. However, the Relative Strength Index (RSI) of 47.66 suggests that Bank of America is oversold.
移動平均收斂散度(MACD)指標爲0.28,進一步支撐了看漲情緒。但是,47.66的相對強弱指數(RSI)表明美國銀行已超賣。
The Bollinger Bands indicate a bearish sentiment. After treading in the upper bullish band for the past few months, Bank of America's price has recently moved to the lower band, reinforcing the bearish sentiment. Overall, the technical setup appears more bearish than bullish currently for Bank of America stock.
布林帶表示看跌情緒。在過去幾個月中一直處於看漲區間上限之後,美國銀行的價格最近已跌至較低的區間,這加劇了看跌情緒。總體而言,美國銀行股票目前的技術設置似乎更看跌而不是看漲。
Investors may want to wait for potential bullish opportunities for Bank of America stock.
投資者可能希望等待美國銀行股票的潛在看漲機會。
Also Read: America's Credit Card Slump: Delinquencies Reach 12-Year High As Issuers Lower Credit Limits
另請閱讀:美國的信用卡暴跌:隨着髮卡機構降低信貸額度,拖欠額達到12年來的最高水平
Analysts Consensus Ratings
分析師共識評級
Ratings & Consensus Estimates: The consensus analyst rating on Bank of America stock currently stands at Overweight with a price target of $35.36. Recent analyst ratings on the stock from Jefferies; Keefe, Bruyette & Woods; and Evercore ISI Group, have an average price target of $39, with an implied 7.79% upside.
評級和共識估計:分析師對美國銀行股票的共識評級目前爲增持,目標股價爲35.36美元。傑富瑞、Keefe、Bruyette & Woods和Evercore ISI集團最近對該股的分析師評級將平均目標股價定爲39美元,隱含上漲幅度爲7.79%。
The upcoming earnings release for Bank of America has the potential to significantly influence trader sentiments. As market participants await the earnings numbers, they will likely weigh this data alongside the technical signals to determine the stock's trajectory in the short term.
美國銀行即將發佈的業績有可能對交易者的情緒產生重大影響。在市場參與者等待收益數字之際,他們可能會將這些數據與技術信號進行權衡,以確定股票的短期走勢。
BAC Price Action: Bank of America stock was trading up o.36% at $35.92 at the time of publication Monday.
BAC價格走勢:週一公佈時,美國銀行股價上漲0.36%,至35.92美元。
Photo: Shutterstock
照片:Shutterstock
譯文內容由第三人軟體翻譯。