
 Yahoo Finance
 Return Trends At H World Group (NASDAQ:HTHT) Aren't Appealing
What trends should we look for it we want to identify stocks that can multiply in value over the long term? Firstly, we'd want to identify a growing return on capital employed (ROCE) and then alongside that, an ever-increasing base of capital employed. This shows us that it's a compounding machine, able to continually reinvest its earnings back into the business and generate higher returns. With that in mind, the ROCE of H World Group (NASDAQ:HTHT) looks decent, right now, so lets see what the trend of returns can tell us.
What Is Return On Capital Employed (ROCE)?
For those that aren't sure what ROCE is, it measures the amount of pre-tax profits a company can generate from the capital employed in its business. To calculate this metric for H World Group, this is the formula:
Return on Capital Employed = Earnings Before Interest and Tax (EBIT) ÷ (Total Assets - Current Liabilities)
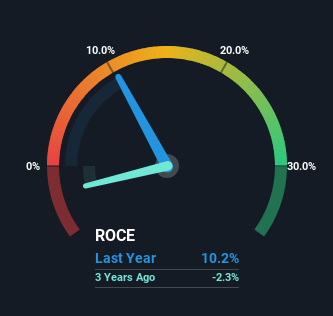
0.10 = CN¥4.7b ÷ (CN¥64b - CN¥17b) (Based on the trailing twelve months to December 2023).
Thus, H World Group has an ROCE of 10%. By itself that's a normal return on capital and it's in line with the industry's average returns of 9.6%.
View our latest analysis for H World Group
Above you can see how the current ROCE for H World Group compares to its prior returns on capital, but there's only so much you can tell from the past. If you're interested, you can view the analysts predictions in our free analyst report for H World Group .
What Can We Tell From H World Group's ROCE Trend?
While the returns on capital are good, they haven't moved much. Over the past five years, ROCE has remained relatively flat at around 10% and the business has deployed 156% more capital into its operations. 10% is a pretty standard return, and it provides some comfort knowing that H World Group has consistently earned this amount. Stable returns in this ballpark can be unexciting, but if they can be maintained over the long run, they often provide nice rewards to shareholders.
Our Take On H World Group's ROCE
In the end, H World Group has proven its ability to adequately reinvest capital at good rates of return. However, over the last five years, the stock hasn't provided much growth to shareholders in the way of total returns. That's why we think it'd be worthwhile to look further into this stock given the fundamentals are appealing.
Like most companies, H World Group does come with some risks, and we've found 1 warning sign that you should be aware of.
For those who like to invest in solid companies, check out this free list of companies with solid balance sheets and high returns on equity.
Have feedback on this article? Concerned about the content? Get in touch with us directly. Alternatively, email editorial-team (at) simplywallst.com.
This article by Simply Wall St is general in nature. We provide commentary based on historical data and analyst forecasts only using an unbiased methodology and our articles are not intended to be financial advice. It does not constitute a recommendation to buy or sell any stock, and does not take account of your objectives, or your financial situation. We aim to bring you long-term focused analysis driven by fundamental data. Note that our analysis may not factor in the latest price-sensitive company announcements or qualitative material. Simply Wall St has no position in any stocks mentioned.
