
 Yahoo Finance
 Under The Bonnet, Dr. Martens' (LON:DOCS) Returns Look Impressive
If we want to find a stock that could multiply over the long term, what are the underlying trends we should look for? Typically, we'll want to notice a trend of growing return on capital employed (ROCE) and alongside that, an expanding base of capital employed. Put simply, these types of businesses are compounding machines, meaning they are continually reinvesting their earnings at ever-higher rates of return. With that in mind, the ROCE of Dr. Martens (LON:DOCS) looks great, so lets see what the trend can tell us.
Understanding Return On Capital Employed (ROCE)
For those who don't know, ROCE is a measure of a company's yearly pre-tax profit (its return), relative to the capital employed in the business. To calculate this metric for Dr. Martens, this is the formula:
Return on Capital Employed = Earnings Before Interest and Tax (EBIT) ÷ (Total Assets - Current Liabilities)
0.20 = UK£166m ÷ (UK£1.0b - UK£201m) (Based on the trailing twelve months to September 2023).
So, Dr. Martens has an ROCE of 20%. On its own, that's a very good return and it's on par with the returns earned by companies in a similar industry.
See our latest analysis for Dr. Martens
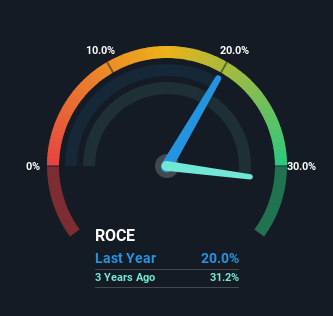
Above you can see how the current ROCE for Dr. Martens compares to its prior returns on capital, but there's only so much you can tell from the past. If you'd like to see what analysts are forecasting going forward, you should check out our free analyst report for Dr. Martens .
How Are Returns Trending?
We like the trends that we're seeing from Dr. Martens. The numbers show that in the last five years, the returns generated on capital employed have grown considerably to 20%. The amount of capital employed has increased too, by 113%. So we're very much inspired by what we're seeing at Dr. Martens thanks to its ability to profitably reinvest capital.
What We Can Learn From Dr. Martens' ROCE
A company that is growing its returns on capital and can consistently reinvest in itself is a highly sought after trait, and that's what Dr. Martens has. Although the company may be facing some issues elsewhere since the stock has plunged 79% in the last three years. Still, it's worth doing some further research to see if the trends will continue into the future.
Since virtually every company faces some risks, it's worth knowing what they are, and we've spotted 4 warning signs for Dr. Martens (of which 1 is potentially serious!) that you should know about.
If you'd like to see other companies earning high returns, check out our free list of companies earning high returns with solid balance sheets here.
Have feedback on this article? Concerned about the content? Get in touch with us directly. Alternatively, email editorial-team (at) simplywallst.com.
This article by Simply Wall St is general in nature. We provide commentary based on historical data and analyst forecasts only using an unbiased methodology and our articles are not intended to be financial advice. It does not constitute a recommendation to buy or sell any stock, and does not take account of your objectives, or your financial situation. We aim to bring you long-term focused analysis driven by fundamental data. Note that our analysis may not factor in the latest price-sensitive company announcements or qualitative material. Simply Wall St has no position in any stocks mentioned.
